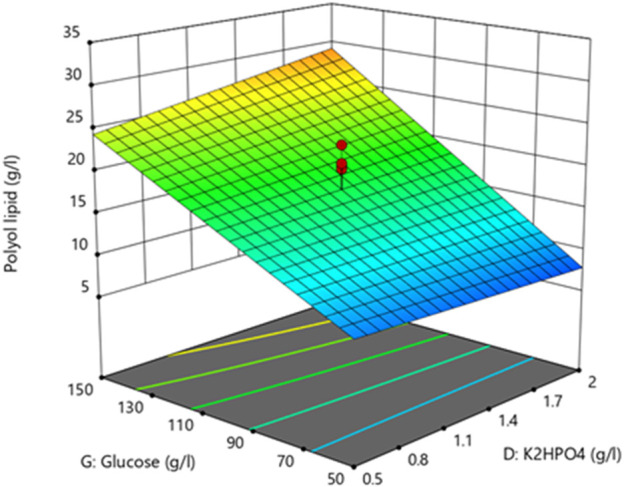
FIGURE 4.

3D-surface diagram from two-level factorial design: Interaction between glucose and K2HPO4 concentration influences the polyol lipid titer. Increasing polyol lipid titers are displayed by a color gradient from low (blue) to high (orange). Center points are represented by red dots.
