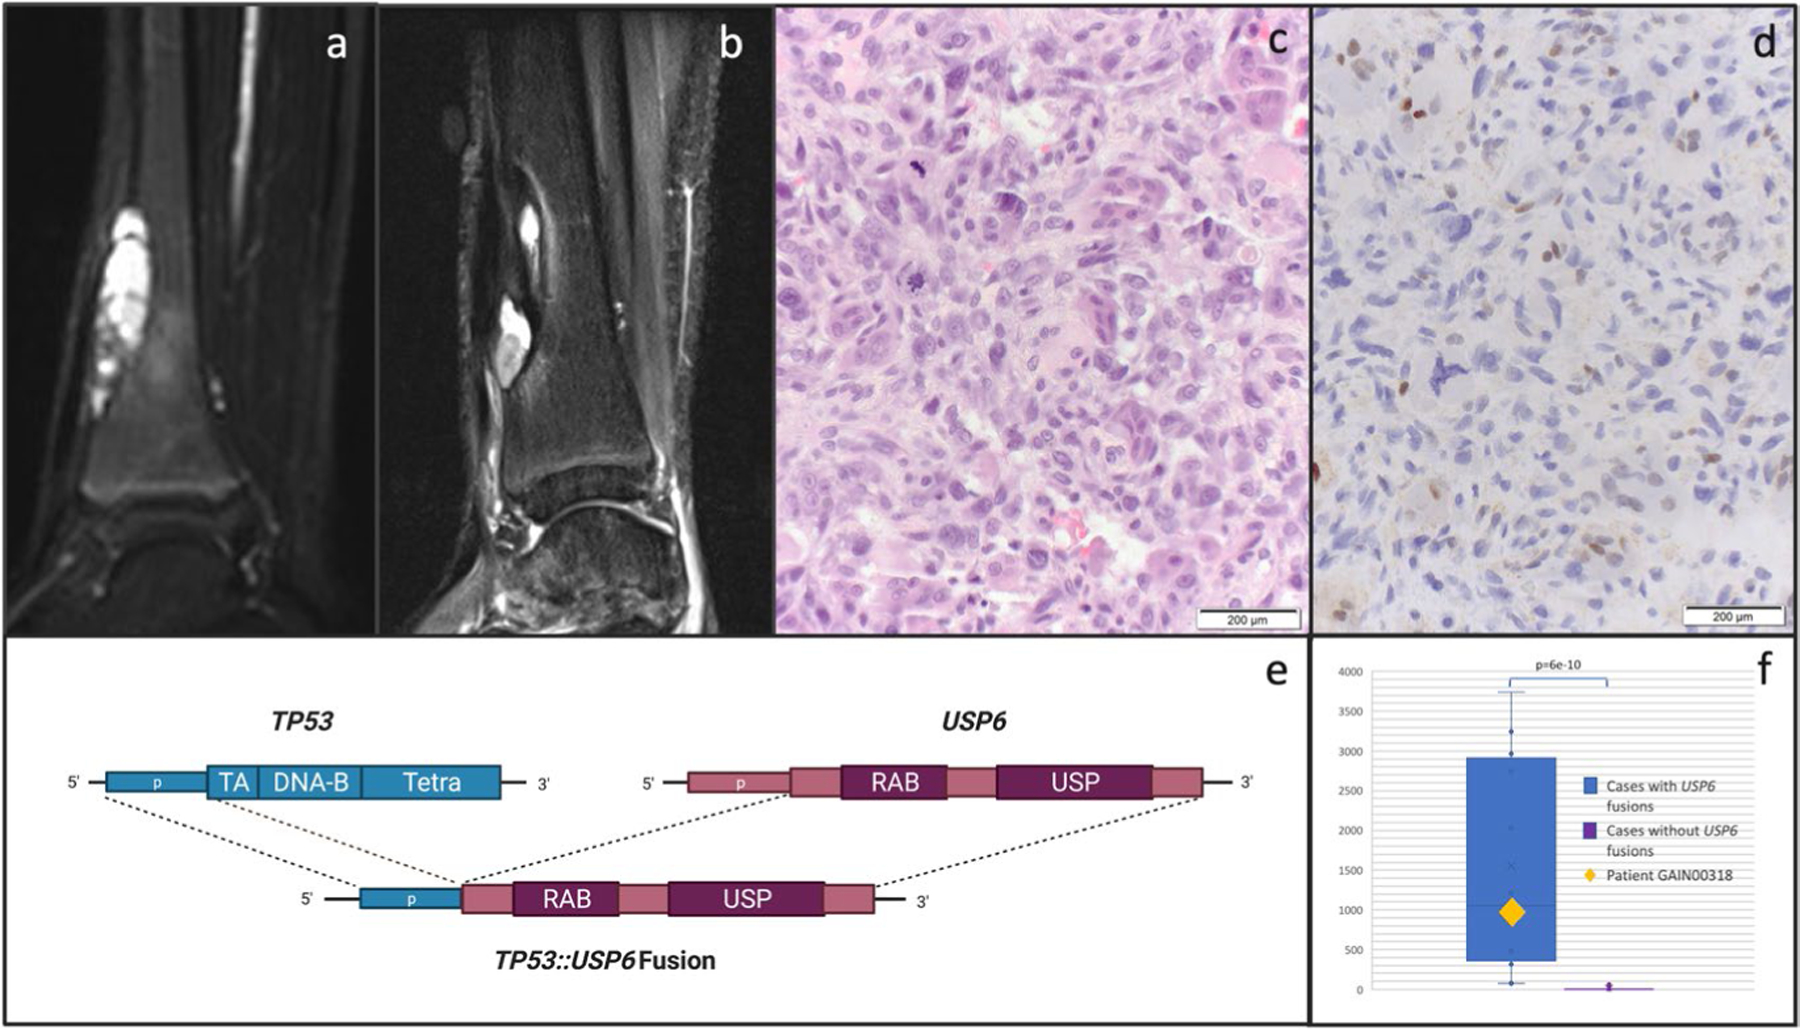
Extended Data Fig. 8 |. Diagnostic Impact Case.

Details of an illustrative case (GAIN318) of diagnostic impact: MRI (sagittal short inversion time inversion recovery (STIR) sequence) of a distal tibia tumor at diagnosis (a) and one year later at recurrence (b). The diagnosis rendered in the pathology report at initial diagnosis was aneurysmal bone cyst (ABC) while biopsy of the recurrence demonstrated osteogenic cells with pleomorphism and atypical mitotic figures (c, H&E stain, single experiment, not repeated). p53 IHC (d) shows loss of p53 expression in tumor but not normal cells (single experiment, not repeated). GAIN sequencing identified a novel TP53::USP6 fusion connecting TP53 intron 1 to USP6 intron 7, supporting a diagnosis of osteosarcoma in which TP53 rearrangements are common (e, created with Biorender.com). RNA analysis shows high expression of USP6, as measured by the number of unique RNA reads across 4 USP6 target regions [chr17:5031701, chr17:5033235, chr17:5033666, chr17:5033937], shown in the context of 12 cases with USP6 fusions (left, average read count 1552 reads) compared to 20 control cases with no USP6 fusions (right, average read count 8.0). This represents a significant difference in expression (unpaired two-tail t-test, p = 6.3e-10). Box plots represent maximum and minimum values (whiskers), first and third quartiles (bounds of box) and median (center line) (f).
