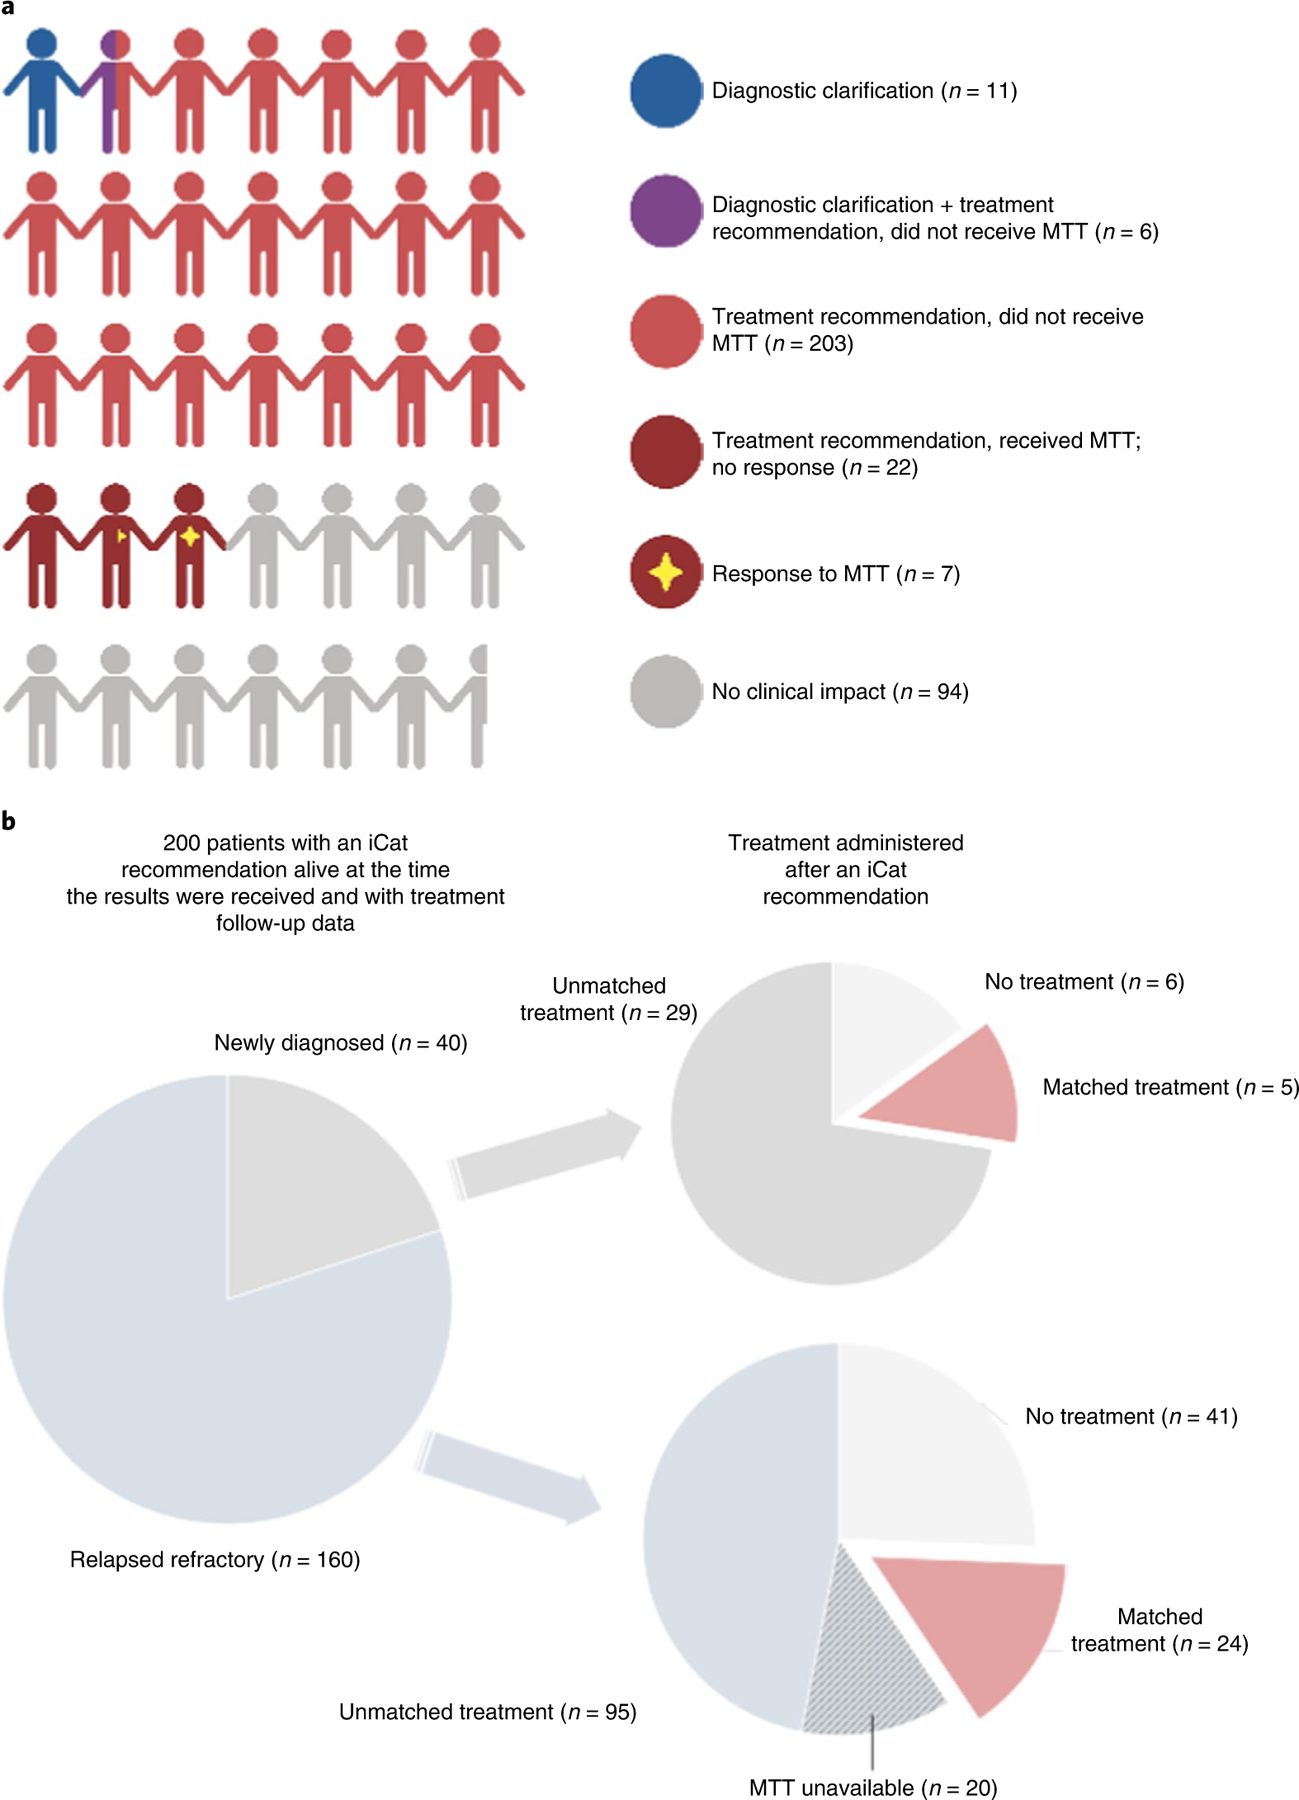
Fig. 2 |. Summary infographic of the outcome for the 345 patients in the analytical cohort after return of genomic results with diagnostic or therapeutic significance.

a, Each cartoon person represents 10 patients. Overall, 73% of patients had an impact on care, including 17 patients with a change in their diagnosis (blue and purple) and 29 patients receiving MTT (dark red) with 7 of these having a response (dark red with star). Created with Biorender. com. b, Treatment received by the 200 patients with therapeutically actionable alterations resulting in an iCat recommendation and sufficient treatment follow-up data to be eligible for assessment of MTT. Patients did not receive MTT because they either received no therapy (n = 46), were newly diagnosed and receiving initial treatment (n = 29) or MTT was not available (n = 23).
