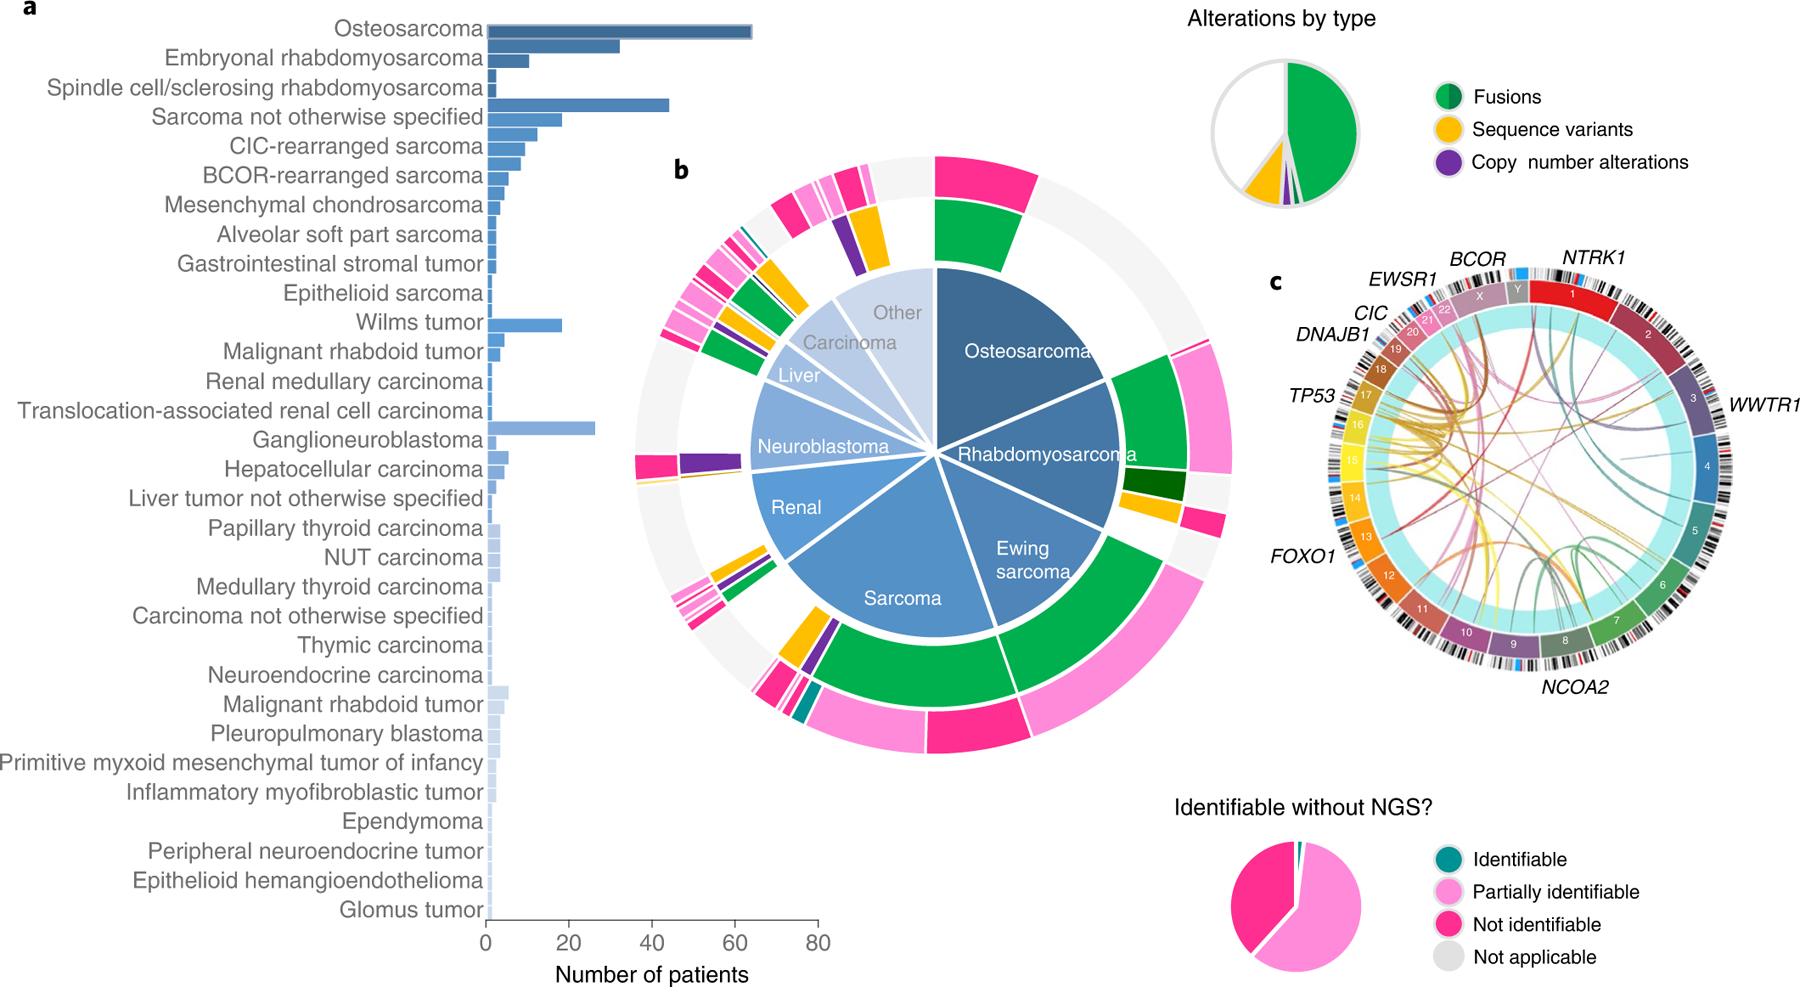
Fig. 4 |.

a,b, Diagnoses and diagnostically significant alterations. In 345 patients, 59 distinct solid tumor diagnoses were made, including many sarcomas and rare tumors, shown in the histogram (a), grouped by diagnostic bins in the central pie chart (b). Two hundred and eight patients had diagnostic alterations with tier 1 or 2 impact according to the AMP/CAP/ASCO guidelines. Diagnostic alterations for each patient are displayed in the inner ring and are grouped by diagnostic bins shown in the central pie chart. Fusions (green) consist of most of the diagnostically significant alterations. The outer ring shows patients whose alterations would have been identified using traditional techniques like FISH, PCR with reverse transcription or IHC: 4 patients (1.9%) would have had their diagnostic variant identified; 125 patients (60%) would have had their alterations partially identified; and the diagnostic alterations of 80 patients (38%) would have been completely missed using traditional assays. c, The Circos plot shows the wide variety of genes involved in diagnostic fusions. Circos plot created with Circa (http://omgenomics.com/circa).
