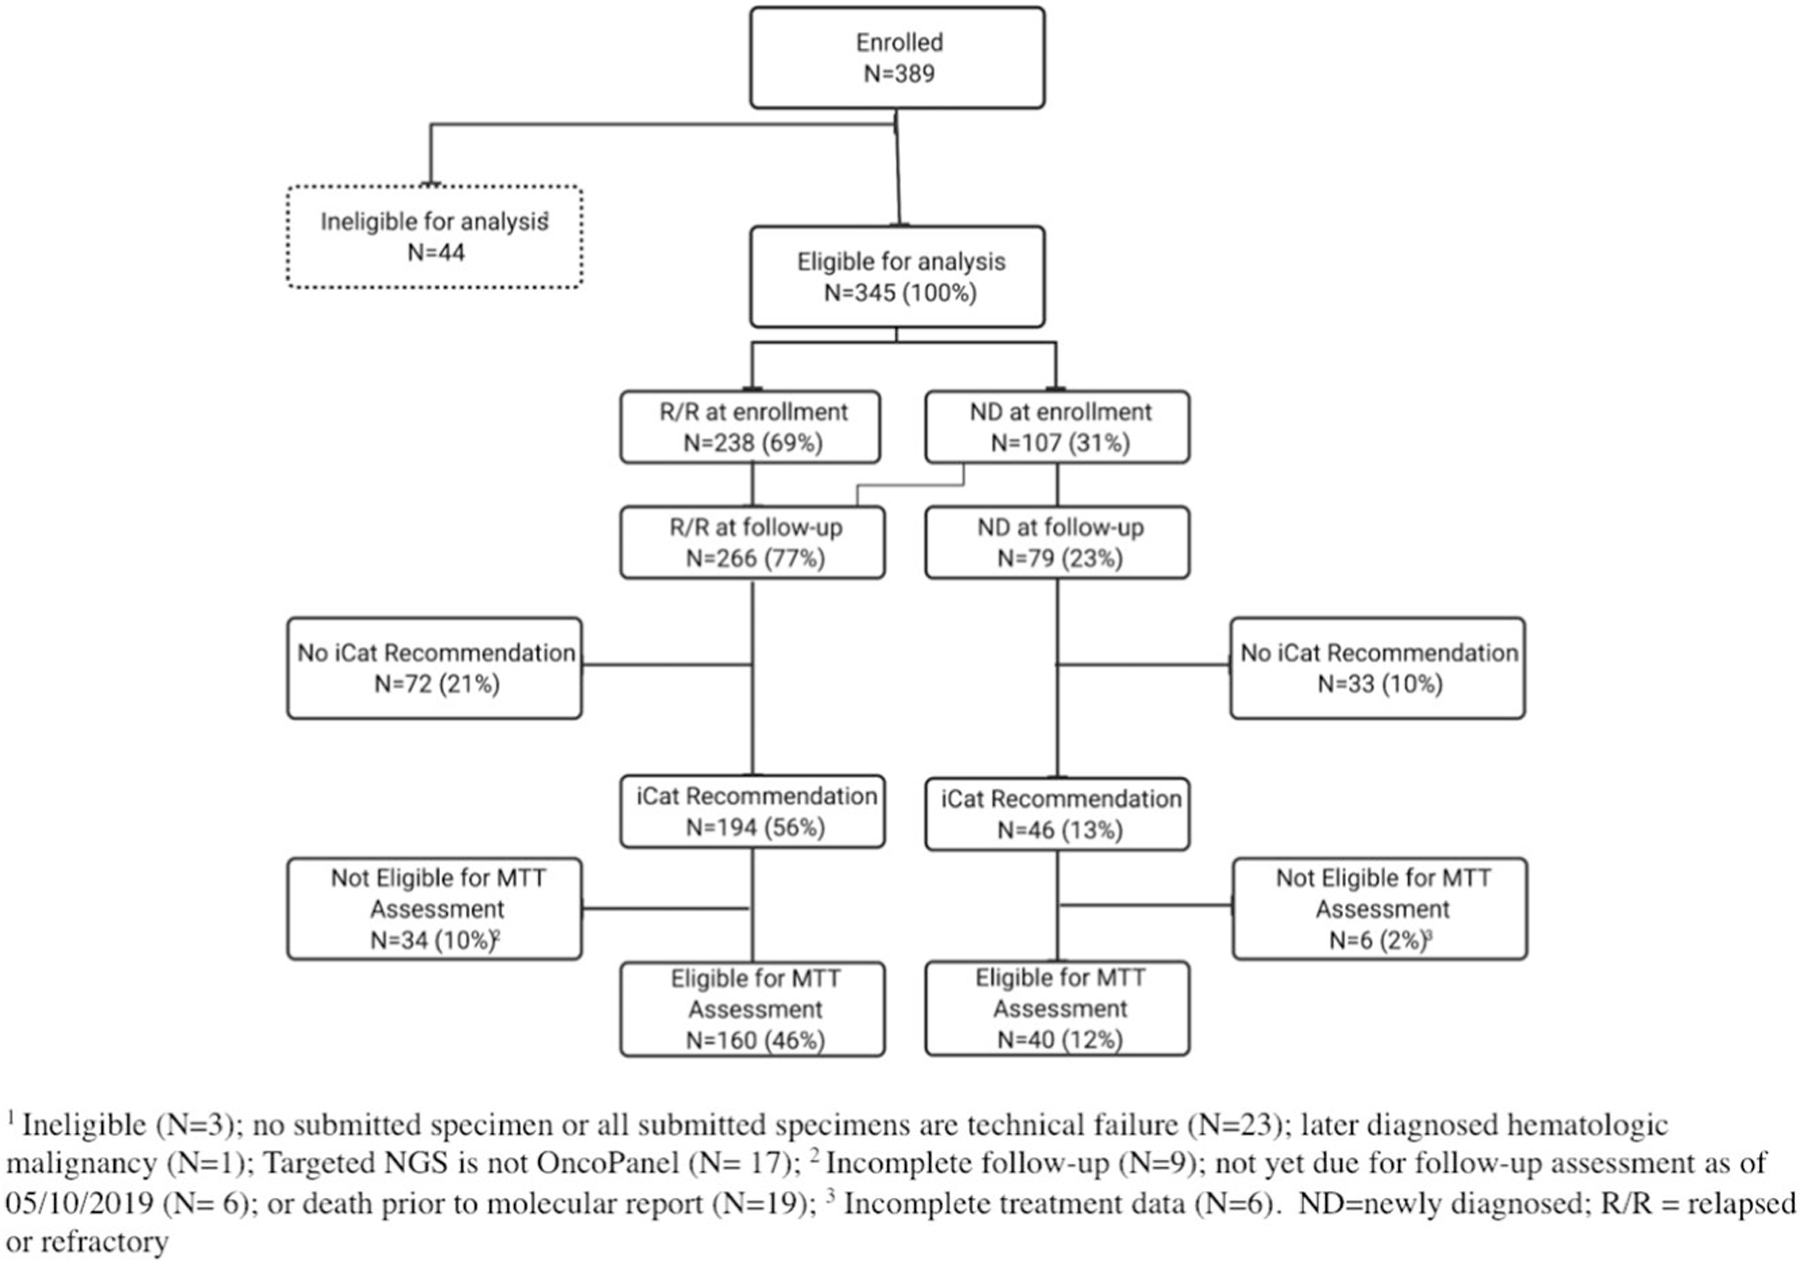
Extended Data Fig. 1 |. CONSORT diagram.

CONSORT diagram of 389 patients enrolled in the GAIN/iCat2 study between 11/2015 and 12/2018 identifying the analytic cohort. Percentages are based on the analytic population (n = 345).

CONSORT diagram of 389 patients enrolled in the GAIN/iCat2 study between 11/2015 and 12/2018 identifying the analytic cohort. Percentages are based on the analytic population (n = 345).