
Figure 6.
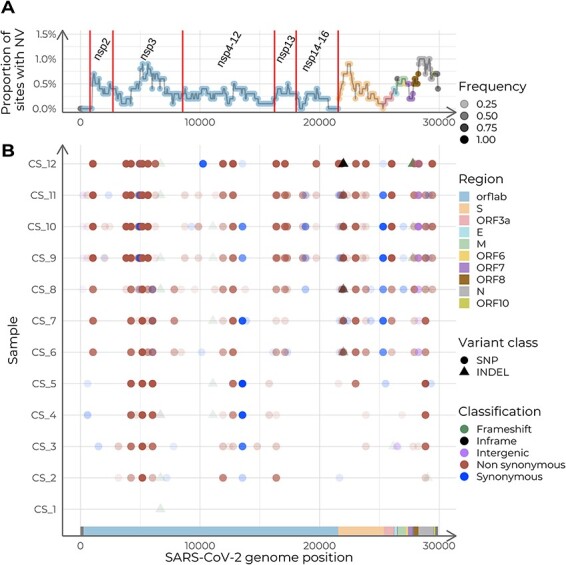
Summary of the intra-host accumulation of nucleotide variants (NV), using the dataset ancestor as reference. (A) Nucleotide variants per site along the SARS-CoV-2 genome. Relative abundance of NVs is calculated with a sliding window of width 1,000 nucleotides and a step of fifty. Labels indicate the coding regions of the non-structural proteins (NSP) within ORF1ab. (B) Genome variation along the genome for each sample. The y-axis displays samples in chronological order, with the earliest collection date at the bottom and the latest at the top.