
Figure 8.
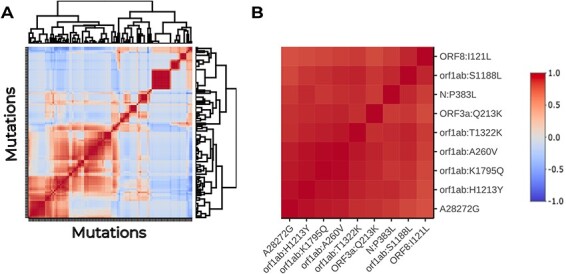
Heatmap of the association between polymorphism trajectories in the case study. (A) Hierarchically clustered heatmap of the pairwise Pearson’s correlation coefficients between the time series of allele frequencies in the case study. The cluster containing the previously found mutations is squared in black. (B) Subset of the correlation heatmap, restricted to the cluster marked in (A).