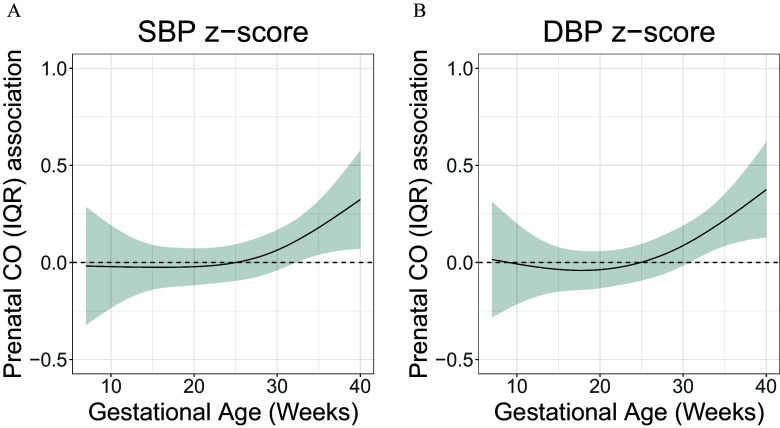
Figure 2.
Time-varying associations between prenatal household air pollution exposure, as represented by personal carbon monoxide (CO), and resting (A) systolic blood pressure (SBP) and (B) diastolic BP (DBP) -scores at 4 years of age in the GRAPHS intervention study, Ghana. The multivariable model 1 ( observations from children) adjusted for child sex and BMI; maternal ethnicity, secondhand tobacco smoke exposure and enrollment BP; and household asset index. The y-axis represents the time-varying association between BP -score and an interquartile (IQR) increase in CO exposure; the x-axis depicts gestational age in weeks at CO measurement. The solid line shows the predicted estimate, and the shaded area represents the 95% CI. A sensitive window was identified when the CIs did not include zero. Data are included in Excel Table S1. Note: BMI, body mass index; CI, confidence interval; GRAPHS, Ghana Randomized Air Pollution and Health Study.

