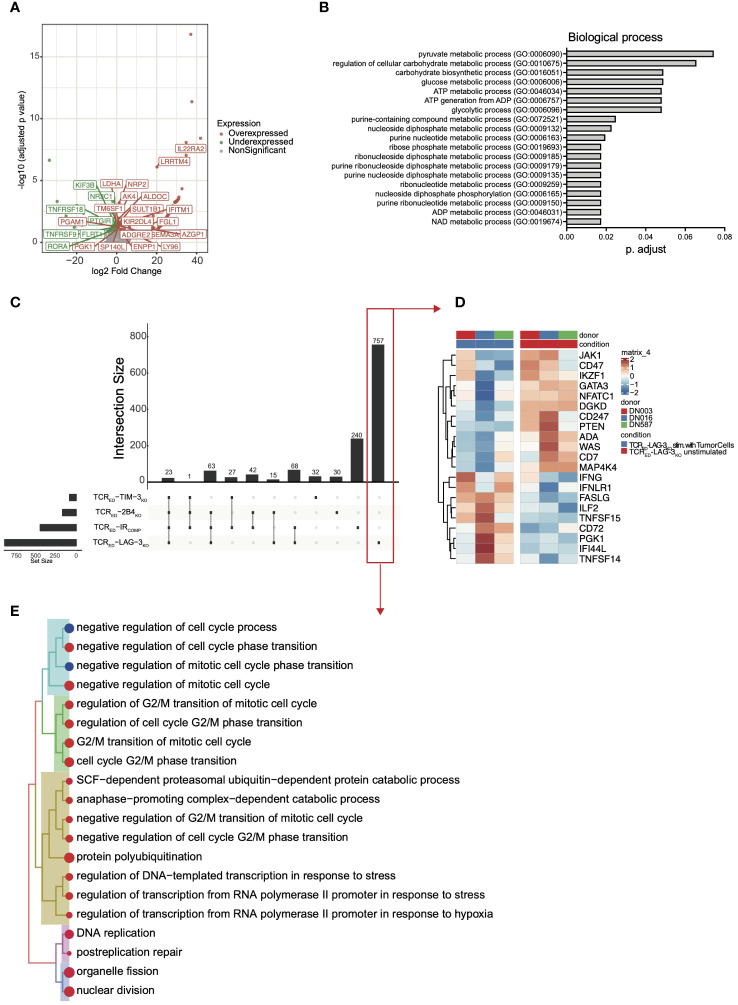
Figure 3.
TCRED-IRKO cells display a unique transcriptional profile upon target recognition. Volcano plot showing significant down- (green) and up- (red) regulated genes (A) and curated Gene ontology terms (biological process-(B) in stimulated TCRED-LAG-3KO vs stimulated TCRED-IRCOMP cells. (C) UpSet analysis showing shared (connected dots in the lower panel) or unique (not-connected dots in the lower panel) differentially expressed genes in stimulated vs unstimulated TCRED-IRCOMP, TCRED-LAG-3KO, TCRED-TIM-3KO, TCRED-2B4KO cells. (D) Heatmap showing the level of expression of selected genes among the 757 uniquely differentially expressed genes in TCRED-LAG-3KO upon target recognition (red box in panel (C). (E) Treeplot of Gene Ontology (Biological Process) terms enriched uniquely in TCRED-LAG-3KO upon target recognition (red box in panel (C)). Data are shown for 3 biological replicates for each cellular product, generated from 3 matched healthy donors. MM1.s A2posESO-1pos multiple myeloma cells were used as antigen source for T cell stimulation.

