FIGURE 1.
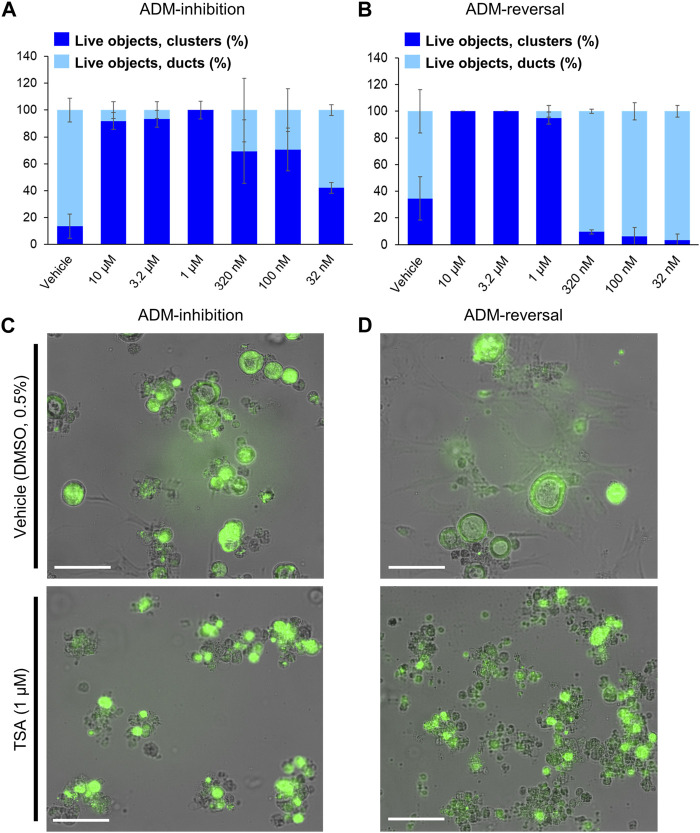
Distribution of viable ducts and acinar clusters in trichostatin A (TSA)-treated organoids. Percent duct/cluster distribution (± SD) of live objects at 72 h post treatment with positive control TSA as a function of the concentration in ADM inhibition (wildtype mouse organoids, Z’ = 0.61) (A) and ADM reversal (Cre-mice organoids, Z’ = 0.56) (B) assays. Representative images at 1 µM TSA for ADM inhibition (C) and ADM reversal (D) assays. Scale bars represent 100 µm. Single biological replicate of quadruplicate technical replicates, mean ± SD.

