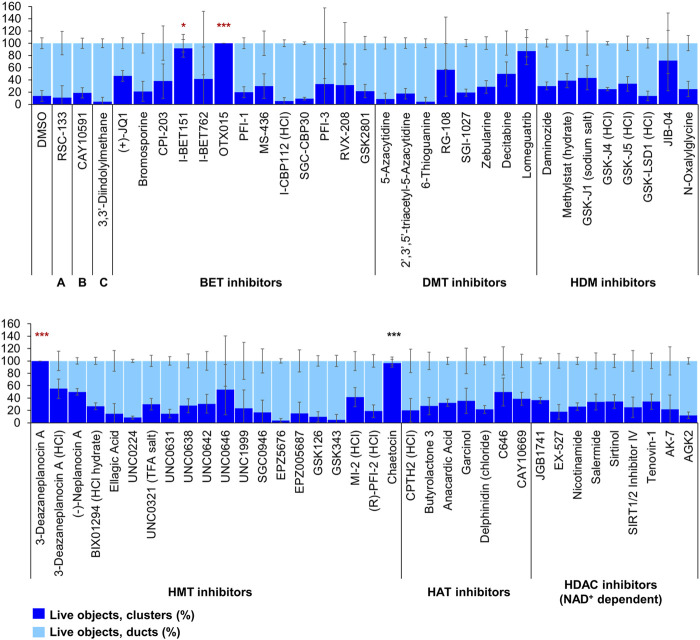
FIGURE 4.
ADM inhibition from epigenetic compound library screen (compounds 1–68 grouped by target). The ADM inhibition assay screen was performed in duplicate using the Cayman ESL on wildtype mouse organoids. The mean percentage of viable ducts and acinar clusters (± SD) 72 h post treatment. BET = bromodomain and extraterminal domain inhibitors; DMT = DNA methyltransferase inhibitors; HDM = histone demethylase inhibitors; HMT = histone methyltransferase inhibitors; HAT = histone acetyltransferase inhibitors; HDAC = histone deacetylase inhibitors (NAD+ dependent); HCl = hydrochloride; TFA salt = trifluoroacetic acid salt. p values were calculated using two-tailed Student’s t-test with unequal variances. Significance was accepted at p ≤ 0.05 only when averages of clusters are higher than the respective vehicle control. *p-value = 0.05–0.01; **p-value = 0.01–0.001; ***p-value < 0.001. Red asterisks denote compounds that showed significantly higher cluster/duct ratios of live objects but had overall less than 50% viability of total objects (false positive). Black asterisks denote compounds that showed significantly higher cluster/duct ratios of live objects and more than 50% of total objects were viable by calcein AM staining (true positive). Single biological replicate of quadruplicate technical replicates, mean ± SD.

