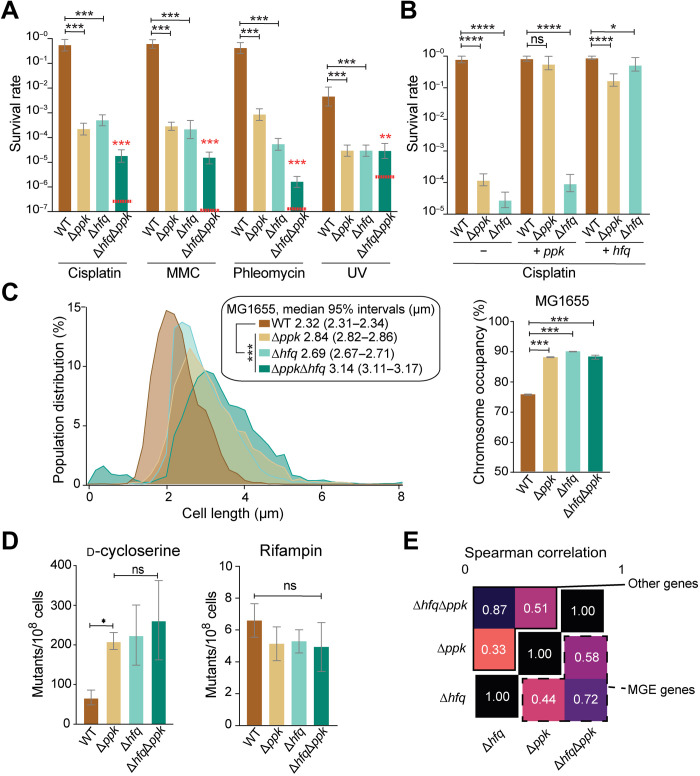
Fig. 2. Hfq and polyP display epistatic relationship in vivo.
(A) Survival assay of MG1655 wt, Δppk, Δhfq, and ΔhfqΔppk upon exposure cisplatin (4 μg/ml), MMC (1 μg/ml), phleomycin (0.25 μg/ml), or UV (25 J/m2). Error bars show 95% credible intervals. Comparisons are scored on the basis of the posterior probability of a difference in parameters in the observed direction: *P > 0.95; ***P > 0.999. The red dashed lines indicate the predicted survival if the effects of the two single mutants were log additive. (B) Survival assay of WT, Δppk, or Δhfq carrying either an empty plasmid (−) or a plasmid overexpressing ppk (ppk+) or hfq (hfq+) upon exposure to cisplatin (4 μg/ml). Error bars denote 95% credible intervals, with * markings based on the posterior probability of a difference in parameters in the observed direction: *P < 0.95; ****P < 0.9999. (C) Left: Cell size distribution of MG1655 wt (n = 8670), Δppk (n = 8089), Δhfq (n = 5875), or ΔhfqΔppk (n = 5954). Right: Associated space occupied by the nucleoid in each mutant under nonstress condition; confidence intervals are obtained on the basis of bootstrapping of the observed cell-level data, and significance calling is performed between each genotype and WT using a Wilcoxon rank sum test (***P < 0.005). (D) Mutant frequencies of WT, Δppk, Δhfq, and ΔhfqΔppk strains upon growth on d-cycloserine or rifampin. (E) Gene expression analysis of MG1655 WT, Δppk, Δhfq, and ΔhfqΔppk. Spearman correlation between phenotypes for “other genes” (continued box, upper triangle) or “MGE genes” (dashed box, lower triangle); all correlations are significant (P < 10−5 in all cases). RNA-seq differential expression analysis on all genotypes is compared to WT for cells grown in glucose minimal medium (corresponding to the non-cisplatin–treated condition in Fig. 1A).

