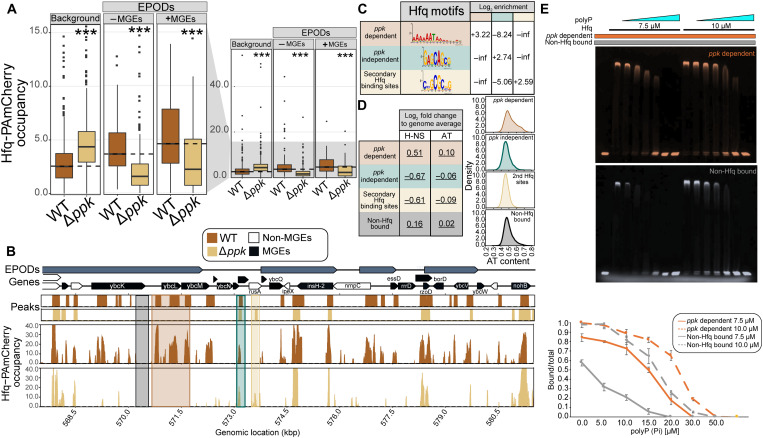
Fig. 3. Loss of ppk alters DNA binding specificity of Hfq.
(A) Average occupancy of Hfq-PAmCherry at chromosomal regions not covered by EPODs (background), at EPODs without MGEs (−MGEs), and at EPODs covering MGEs (+MGEs) (table S2). * indicates significance tested via a Wilcoxon rank sum test comparing Δppk versus WT for each condition with Benjamini-Hochberg corrections applied (***q < 0.0005). (B) Hfq-PAmCherry occupancy in MG1655 with hfq-PAmCherry (brown) and Δppk (gold) at selected prophage gene-containing region. Highlighted regions exemplify ppk-dependent (brown), ppk-independent (green), or secondary (gold) Hfq binding sites and unbound regions (black). kbp, kilo–base pair. (C) Top motif calculated from MEME-ChIP results for each peak category. The log2 motif enrichment was calculated across each category. Inf and −inf denote positive and negative infinity, respectively, and arise when there are no members of one of the classes being compared. (D) The 500-bp rolling mean for the binding of H-NS and the AT content of the genome was used to calculate the group-level means across each peak class. The log2 fold change was calculated in comparison with the overall average for the genome. Permutation test–based P values were calculated comparing each class versus the entire genome. The values underlined had P < 0.05. (E) Electrophoretic mobility shift assay (EMSA) of a mixture of 37.5 nM FAM-labeled AT-rich DNA (ppk-dependent, orange) and 37.5 nM Cy3-labeled GC-rich DNA (non-Hfq bound, gray) with Hfq and/or polyP present as indicated. PolyP300 concentrations are in ascending order: 5 10, 15, 20, 30, or 50 μM in Pi units. Gels were imaged and overlayed using ImageJ. Quantification of the % shifted DNA over total DNA was conducted in ImageJ. The average of three biological replicates is shown, with error bars representing SD.

