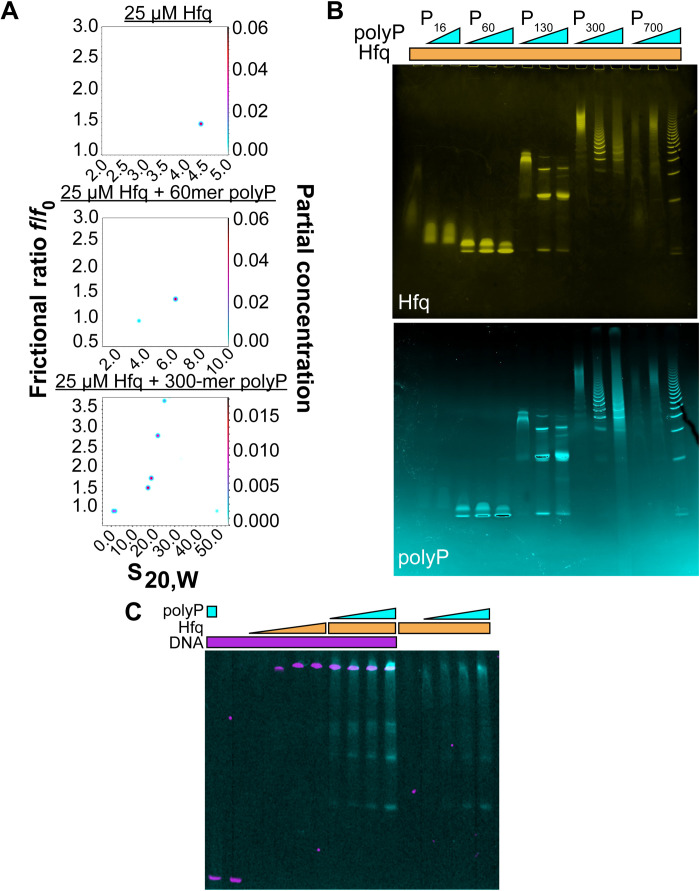
Fig. 4. In vitro interactions of Hfq, polyP, and DNA.
(A) Two-dimensional analysis plots of frictional ratio f/f0 versus sedimentation coefficient S for 25 μM Hfq ± 250 μM polyP60 or polyP300. The color in the z dimension represents the abundance of each species according to the partial concentration as indicated in the right y axis. (B) Mobility of Hfq (25 μM) on native gels without (lane 1) or with 65, 125, or 250 μM of various polyP chain lengths. PolyP16 was used at 125 and 250 μM only (lanes 2 and 3). Gels were stained with 4′,6-diamidino-2-phenylindole (DAPI) to visualize polyP (cyan) followed by Coomassie staining to visualize Hfq (yellow). (C) Overlay of EMSA using FAM-labeled ybck-DNA (75 nM) in the presence of 30 μM Alexa Fluor 647 (AF647)–polyP300 (lane 1); in the absence of additives (lane 2); or in the presence of 5, 10, 17.5, or 25 μM Hfq (lanes 3 to 6). AF647-polyP300 (in Pi units) was added at 10, 15, 20, or 30 μM to 25 μM Hfq and DNA (lanes 7 to 10) or 25 μM Hfq only (11–15). Gels were stained with Coomassie to detect Hfq (fig. S4B).

