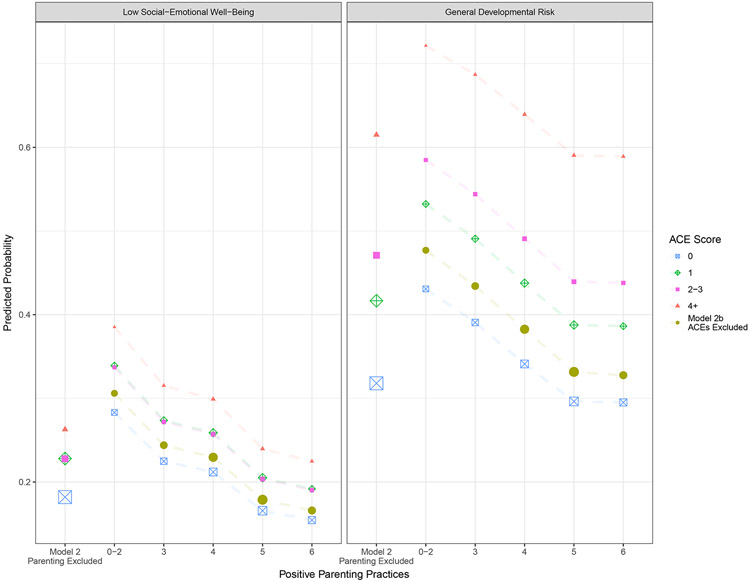
Figure 1.
Predicted Probability Comparisons Across Models
Dots are proportion to population size. Gold dots reflect (model 2b) predicted probabilities WITHOUT adjustment for ACEs. Disconnected dots reflect (model 2) predicted probabilities WITHOUT adjustment for positive parenting. Predictions produced with covariates fixed to modal (male, white not Hispanic, household educated beyond high school) or mean (2.53 years old) values.

