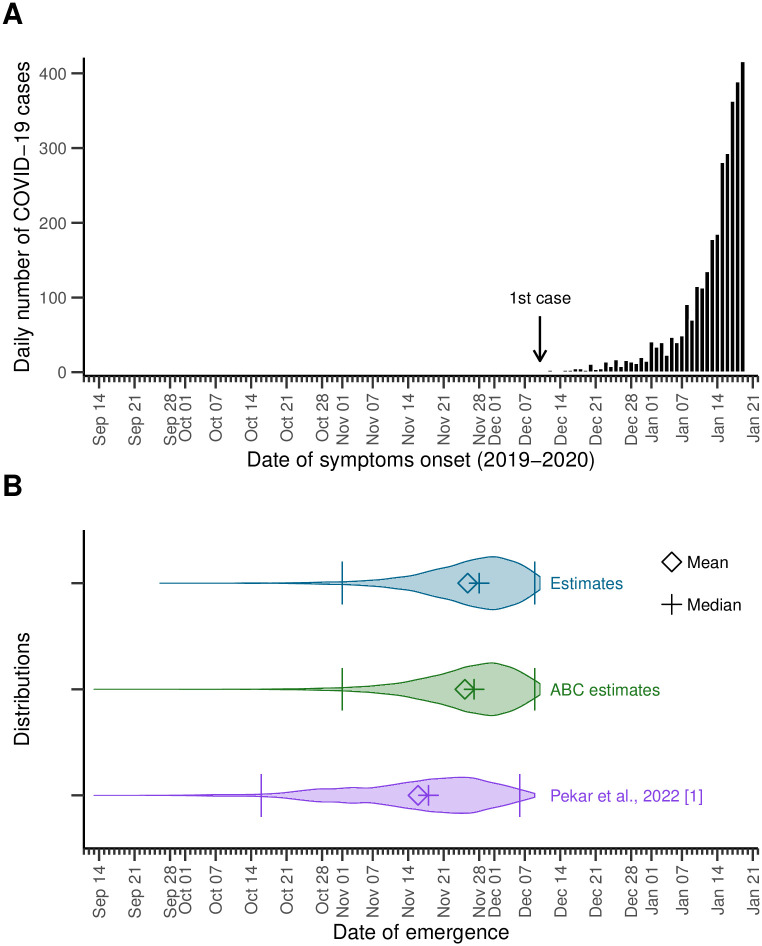
Fig 3. Estimates of the emergence of SARS-CoV-2 in Wuhan.
(A) Observed epidemic curve, for context. A total of N = 3 072 COVID-19 cases with symptom onset between December 10, 2019 and January 19, 2020, the day before the first public statement on human-to-human transmission. NB. The scale of the figure makes the first case and other bins corresponding to sole cases hardly visible; we refer the reader to Fig G in S1 Text for a larger picture of the epidemic curve. (B) Violin plots for the distributions of the date of emergence. We estimated the median date of the first SARS-CoV-2 infection (i.e., emergence) at November 28 (95%IPR: November 2–December 9), 2019 (top, blue; upper and lower bound of the 95%IPR depicted by bars). For comparison, the distribution for the estimates obtained implementing more classical approximate bayesian computation (middle, green), and estimates from [1] (bottom, purple) are also shown.

