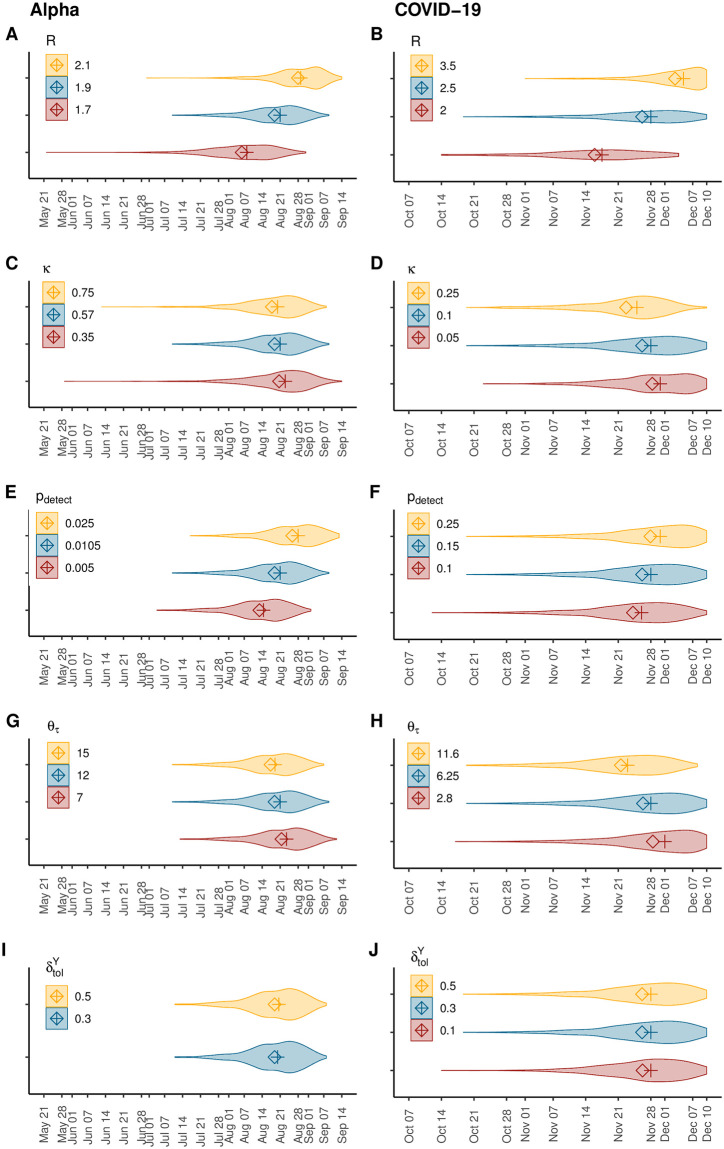
Fig 4. Sensitivity analyses.
Distributions for the date of emergence of the Alpha variant in the UK (left) and the COVID-19 epidemic in Wuhan (right) obtained from running our simulations setting different input values for key model parameters: the reproduction number, R (panels A and B), the overdispersion parameter, κ, (panels C and D), the probability of detection, pdetect (panels E and F), the time elapsed between infection and detection, by varying θτ (panels G and H) and the tolerance for the difference between the simulated and the observed daily number of infections, (panels I and J). The absence of a violin plot for in panel G results from the absence of selected simulations in > 3 million runs. Median values are depicted by crosses and mean values by diamonds. Baseline parameterization of the model is depicted in blue (middle).

