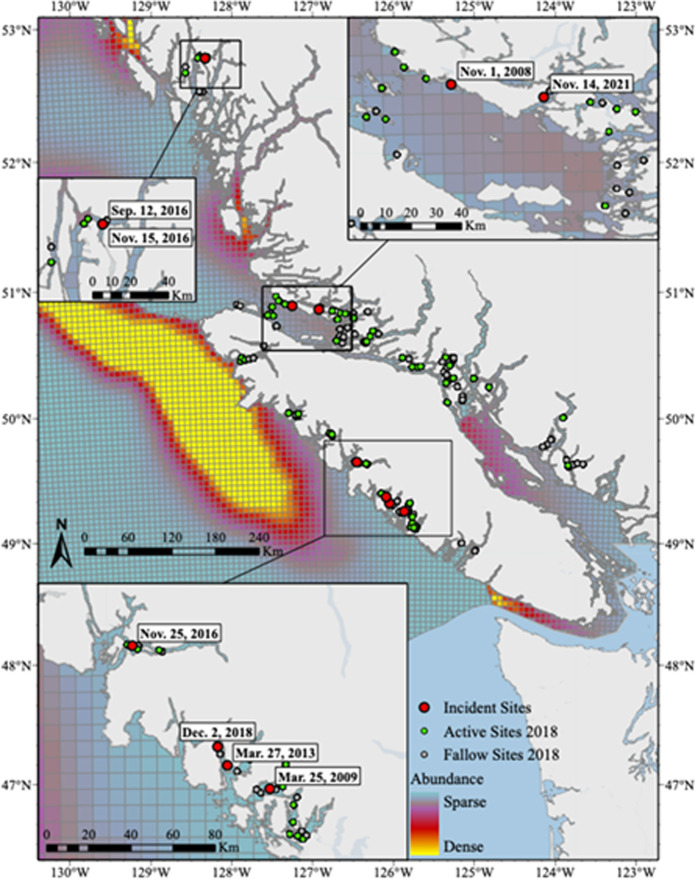
Fig 1. Humpback whale-aquaculture interactions and predicted abundance.
Locations of humpback whale-aquaculture interactions (red points) from 2008–2021, active (teal points) and fallow (grey points) aquaculture sites in 2018, and predicted humpback whale abundance based surveys conducted in the summer of 2018 along the British Columbia coast. Reported entanglement locations (in decimal degrees) were mapped using ArcGIS Pro 3.0.2 with public domain Natural Earth base maps (naturalearthdata.com). Spatial density models predicting humpback whale abundance were reproduced from the PRISMM study [8] with permission. The PRISMM study modelled humpback whale abundance separately for the North Coast, Salish Sea, and West Coast of Vancouver Island. On this map, all three models are plotted together despite being based on different inputs. Note that the surveys were not conducted near-shore or up inlets, and therefore likely underestimate humpback whale presence in these areas. See [8] for complete survey and model details.

