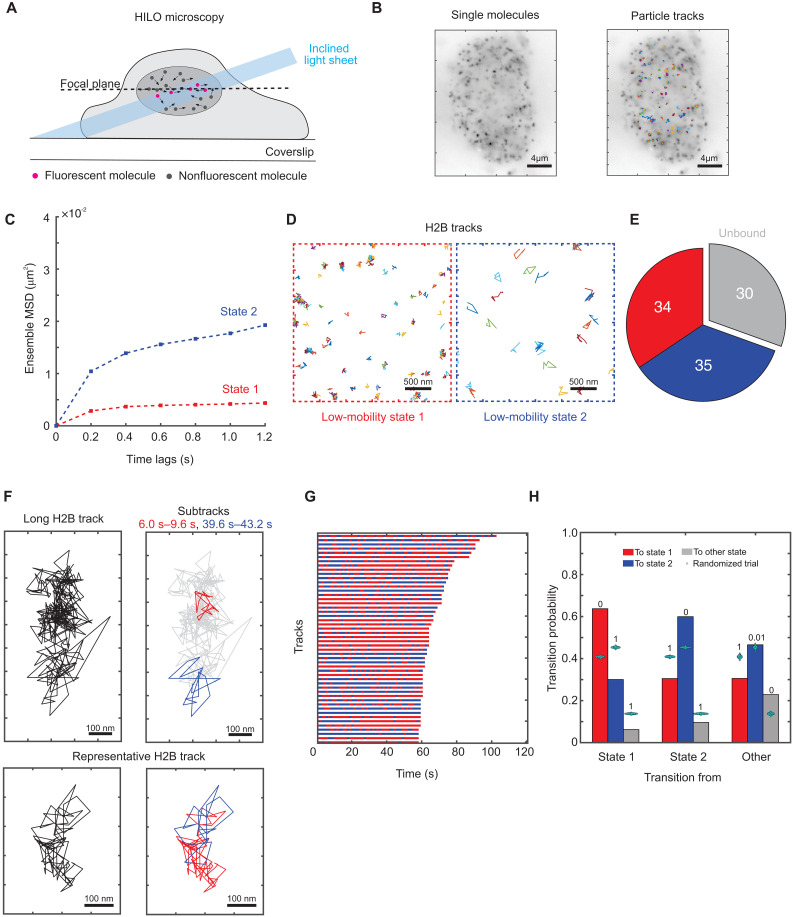
Fig. 1. Histone H2B shows two distinct low-mobility states.
(A) Schematic of SMT experiment. (B) Left: Time projection of a representative H2B-Halo SMT movie (right) overlaid with tracks. (C) Ensemble MSD for histone H2B (Ncells = 149, Ntracks = 25,298, and Nsub-tracks = 88,934). Error bars denote SEMs. (D) Sample tracks assigned to low-mobility state 1 (red) and low-mobility state 2 (blue) for H2B. (E) Pie chart of proportions of H2B sub-tracks assigned to different mobility states. (F) Top left: Representative long H2B track. Top right: Sub-tracks of length 3.6 s color-coded by state assignment (state 1 in red and state 2 in blue) to illustrate differences between the spatial extent of the two states. Bottom left: A representative 16 s H2B track. Bottom right: The same track with the sub-tracks color-coded by state assignment, showing spatial overlap between the two low-mobility states. (G) Temporal reconstruction of the 50 longest tracks for histone H2B. (H) Transition probabilities for H2B among states 1 and 2 and all other states. Cyan swarm charts represent transition probabilities calculated from 1000 randomized ensembles. The numbers above the bars represent the proportion of randomized trials that have a higher transition probability than the respective calculated transition probability.

