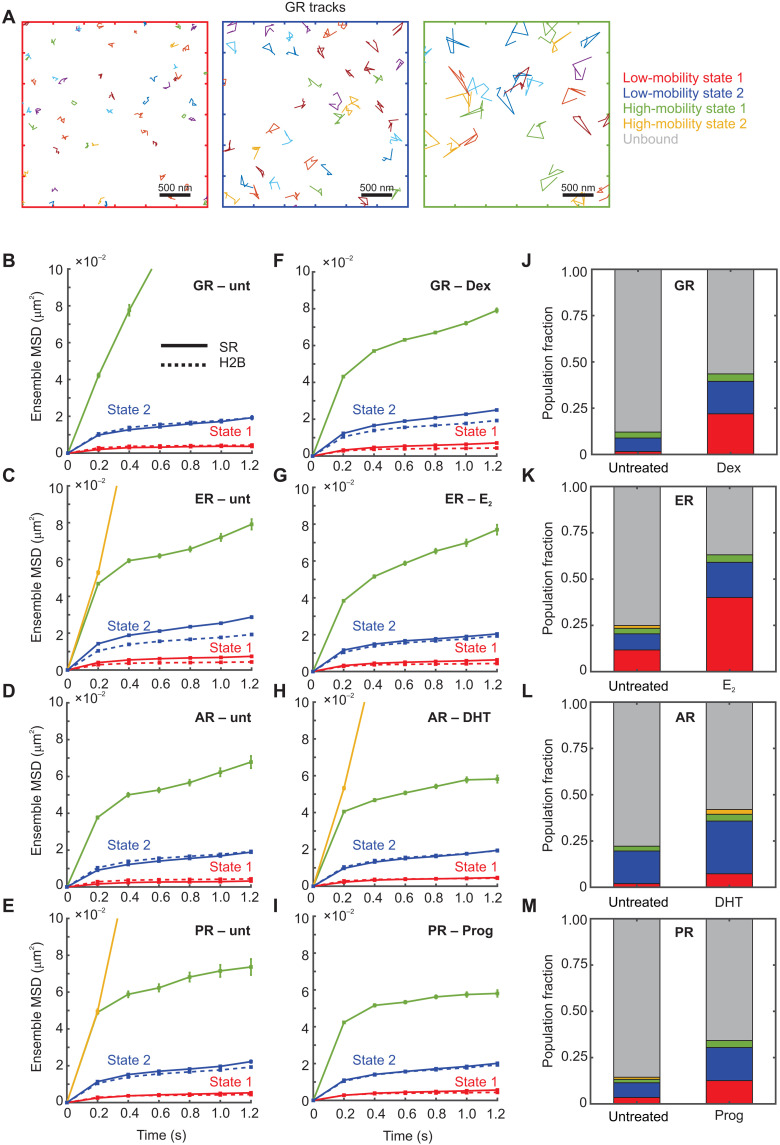
Fig. 2. Steroid receptors also exhibit two low-mobility states, with ligand-dependent population fractions.
(A) Sample tracks for the GR. Left: Low-mobility state 1. Middle: Low-mobility state 2. Right: High-mobility state. (B to I) Ensemble MSD for indicated steroid receptor (solid lines) and histone H2B (dashed lines). Error bars denote SEMs. (B) Untreated GR (Ncells = 35, Ntracks = 386, and Nsub-tracks = 962). (C) Untreated ER (Ncells = 49, Ntracks = 4057, and Nsub-tracks = 9551). (D) Untreated AR (Ncells = 51, Ntracks = 1394, and Nsub-tracks = 4001). (E) Untreated PR (Ncells = 37, Ntracks = 1371, and Nsub-tracks = 3197). (F) GR activated with dexamethasone (Dex) (Ncells = 238, Ntracks = 30,652, and Nsub-tracks = 81,172). (G) ER activated with 17β-estradiol (E2) (Ncells = 50, Ntracks = 8147, and Nsub-tracks = 24,299). (H) AR activated with dihydrotestosterone (DHT) (Ncells = 38, Ntracks = 5160, and Nsub-tracks = 12,697). (I) PR activated with progesterone (Prog) (Ncells = 41, Ntracks = 4951, and Nsub-tracks = 14,899). (J to M) Comparative bar charts showing population fractions of various states for the indicated steroid receptors.

