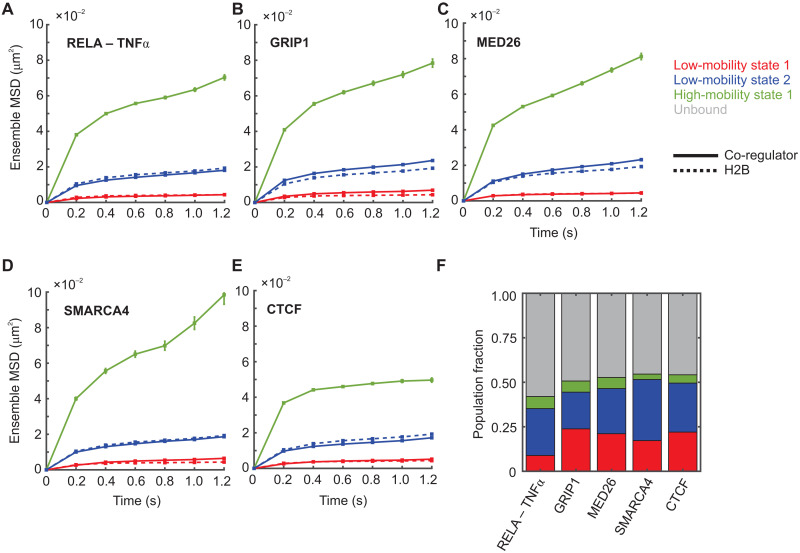
Fig. 4. Other transcriptional regulators also exhibit two distinct low-mobility states.
(A to E) Ensemble MSD plots for the indicated transcriptional co-regulator (solid lines) and histone H2B (dashed lines). Error bars denote SEMs. (A) RELA/p65 activated with TNFα (Ncells = 67, Ntracks = 9524, and Nsub-tracks = 24,634). (B) GRIP1 (Ncells = 36, Ntracks = 4847, and Nsub-tracks = 14,010). (C) MED26 (Ncells = 57, Ntracks = 11,429, and Nsub-tracks = 29,085). (D) BRG1/SMARCA4 (Ncells = 22, Ntracks = 3179, and Nsub-tracks = 8112). (E) CTCF (Ncells = 69, Ntracks = 10,457, and Nsub-tracks = 34,503). (F) Comparative bar chart showing population fractions for the indicated co-regulators.

