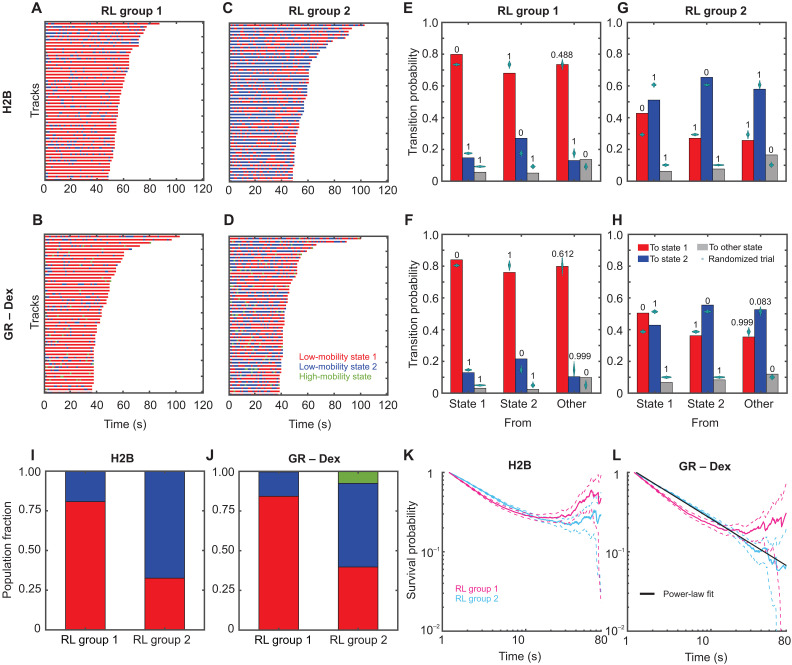
Fig. 6. Tracks with different exploration radii exhibit distinct switching patterns.
(A to D) Temporal reconstruction of the 50 longest tracks of single molecules belonging to RL group 1 (overall lower mobility) (A and B) and to RL group 2 (overall higher mobility) (C) and (D). The tracks are color-coded to show the pEM-identified states of the 1.2-s segments making up the entire track. State 1 is depicted in red, and state 2 is in blue. Higher-mobility states are colored green and yellow: (A) and (C) H2B. (B) and (D) GR activated with Dex. (E to H) Transition probabilities calculated for molecules in RL group 1 (E) and (F) and RL group 2 (G) and (H). Transitions into pEM state 1 are shown in red; those into state 2 are shown in blue, and others are in gray. Cyan swarm charts show the results of the transition probability calculation for 1000 randomly permuted ensembles. Numbers above the bars display the proportion of these trials with a transition probability higher than the respective calculated transition probability: (E) and (G) H2B and (F) and (H) GR activated with Dex. (I and J) Fraction of tracks in pEM state 1 (red), pEM state 2 (blue), and pEM state 3 (green) for trajectories classified into RL groups 1 and 2 for H2B (I) and GR activated with Dex (J). (K and L) Photobleaching corrected survival probability distributions of dwell times for tracks classified into RL group 1 (magenta) and RL group 2 (cyan). Dashed lines indicate the 99% confidence interval. (K) H2B and (L) GR activated with Dex. The black line in (L) represents a power-law fit to the survival distribution for RL group 2 with an exponent β = −0.65 ± 0.01.

