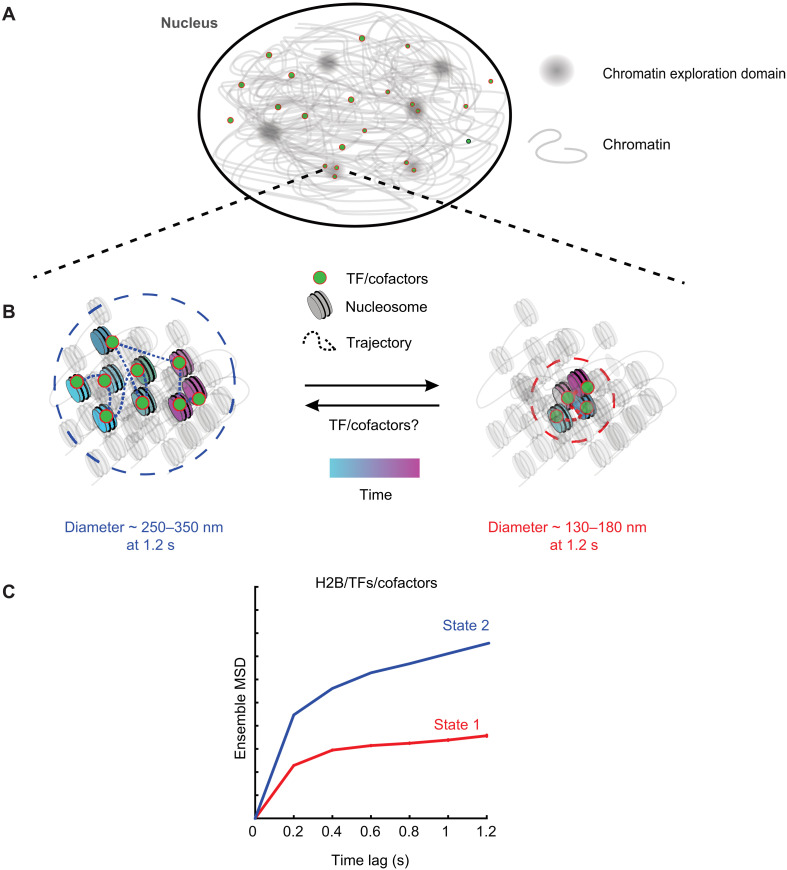
Fig. 7. Two-state model for chromatin and transcriptional regulators.
(A) Over short time scales (~1.2 s), chromatin mobility is constrained within chromatin exploration domains. (B) Within these domains, TFs/cofactors engage with chromatin, and the TF-chromatin complex can exist in one of two low-mobility states. Left: The higher of these two mobility states (state 2) has an exploration diameter of ~250 to 350 nm at 1.2 s. The trajectory shows the motion of a single TF/cofactor molecule over time. The lower-mobility state (state 1) has an exploration diameter of ~130 to 180 nm, and the motion of a single TF/cofactor molecule is represented in the right panel. Chromatin and associated TFs/cofactors can dynamically switch between these two mobility states. TF binding can promote a switch from state 2 to state 1 or unbind from state 2 chromatin and bind to state 1 chromatin within the localized chromatin domain. (C) The MSD plot of tracks classified by perturbation expectation maximization (pEMv2) is used to visualize the two different mobility states under the time scale of a single sub-track (1.2 s). The exploration diameter of the states is estimated as .

