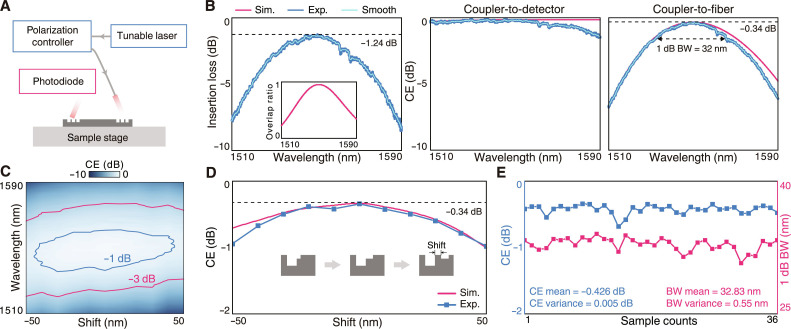
Fig. 4. Characterization of the unidirectional grating coupler.
(A) Schematic of measurement setup for fiber-to-detector optical interconnect. (B) Measured insertion loss of the fiber-to-detector link which consists of a pair of unidirectional grating couplers and a straight waveguide with a length of 7 mm (left). The inset shows the overlap ratio calculated from the mode integral. The spectra of coupler-to-detector (middle) and coupler-to-fiber (right) CEs that are decomposed from the insertion loss and the overlap ratio. (C) The map of smoothed coupler-to-fiber CEs over wavelengths and shift errors with the −1- and – 3-dB contours labeled as blue and red. (D) The peak CEs versus shift errors. (E) The statistics of coupler-to-fiber CEs and 1-dB bandwidth for 36 samples.

