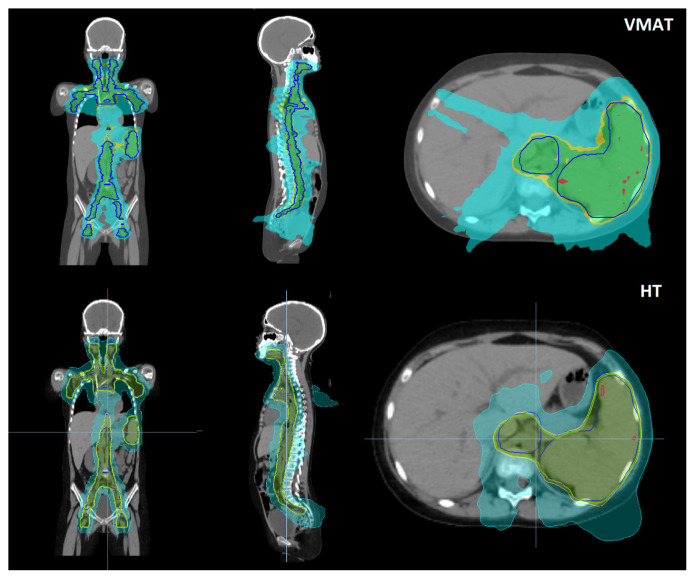
Figure 2.
Isodose curves of 1 patient in sagital, coronal and transverse sections for volumetric modulated arc therapy (VMAT) and helical tomotherapy (HT). Blue line corresponds to the planning target volume (PTV) contour. Dose fill colors red, green, yellow and cyan represent 900, 800 (prescribed dose), 860 and 400 cGy respectively

