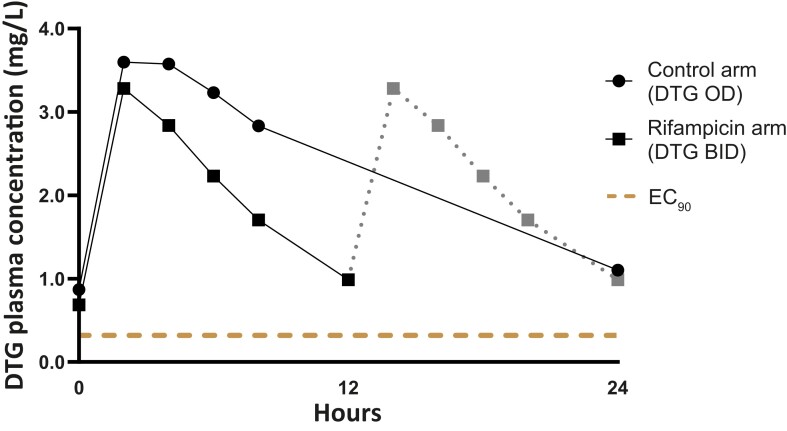
Figure 2.
Geometric mean DTG concentration-time profiles for infants receiving rifampicin and the control arm. The solid lines in the BID curve represent observed concentrations; the gray dotted line represents imputed values by repeating the first 12-hour curve. Abbreviations: BID, twice-daily dosing; DTG, dolutegravir; EC90: 90% effective concentration; OD, once-daily dosing.

