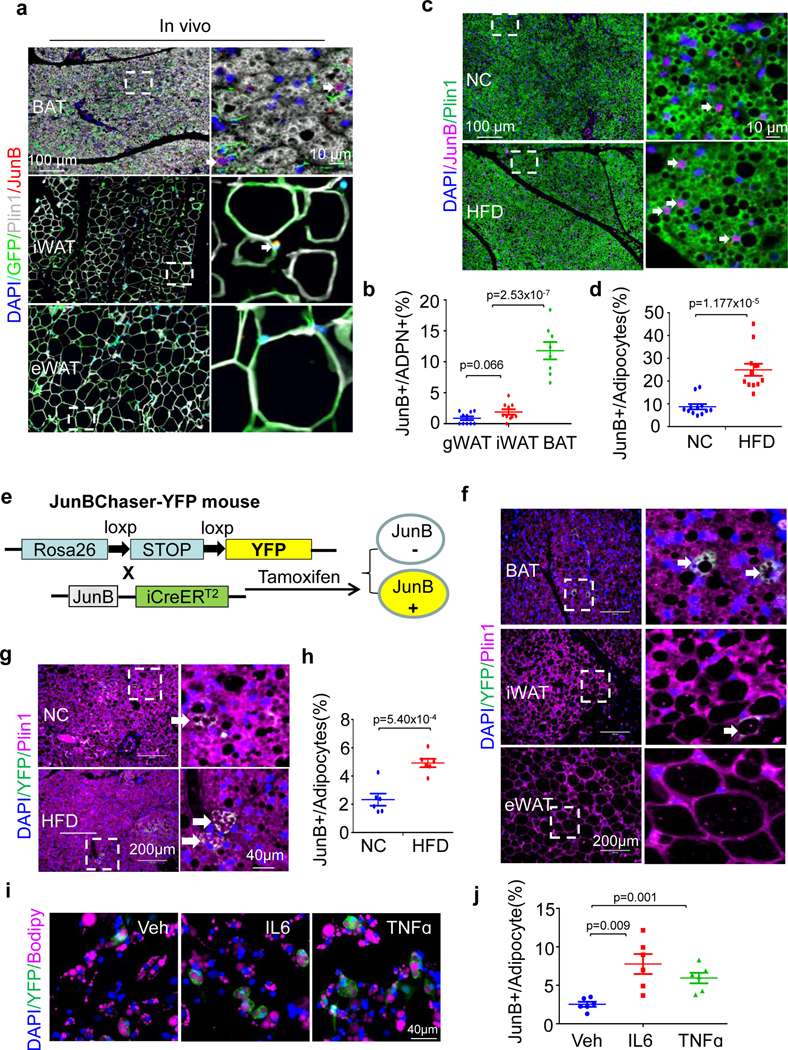
Fig. 2 |. A distinct adipocyte subset that expresses JunB is present in the brown and inguinal fat depots and increased by obesity in abundance.

a, Immunostaining shows the localization of JunB+ adipocytes in BAT, iWAT and gWAT of AdipoChaser mice. Antibodies against JunB (red), Adipoq (green), Plin1 (white) and nucleus (blue) were used for the staining. b, Quantification of JunB-expressing adipocytes in various fat depots as indicated in a (n = 4 mice per group). c, Immunostaining of BAT from mice fed with normal chow (NC) or HFD for 4 weeks. Antibodies recognizing JunB (red), Plin1 (green) and nucleus (blue) were used. d, Quantification of BAT JunB-expressing adipocytes in c (n = 6 mice per group). e, The generation strategy of JunBChaser-YFP mice. f, YFP-expressing adipocytes (green) were more enriched in BAT, albeit in modest numbers in iWAT and gWAT in JunBChaser-YFP mice. Antibodies recognizing perilipin 1 (red) and nucleus (blue) were used. g, YFP+ adipocytes were increased in BAT of JunBChaser-YFP mice after 4 weeks of HFD feeding. Antibodies recognizing YFP (green), perilipin 1 (red) and nucleus (blue) were used. White arrows in a, c, f and g indicate the JunB+ cells h, Quantification of BAT YFP+ adipocytes in g (n = 4 mice per group). i, YFP+ adipocytes (green) were increased by the treatment of 20 ng ml−1 TNF or 20 ng ml−1 IL-6 for 24 h in primary differentiated brown adipocytes. j, Quantification of YFP+ adipocytes in i (n = 3 per group). n = 3 per group for a, c, f, g and i. Microscopic images (×20 objective) were taken. Data in b, d, h and j are presented as the mean ± s.e.m. An unpaired two-sided t-test was used for analysis.
