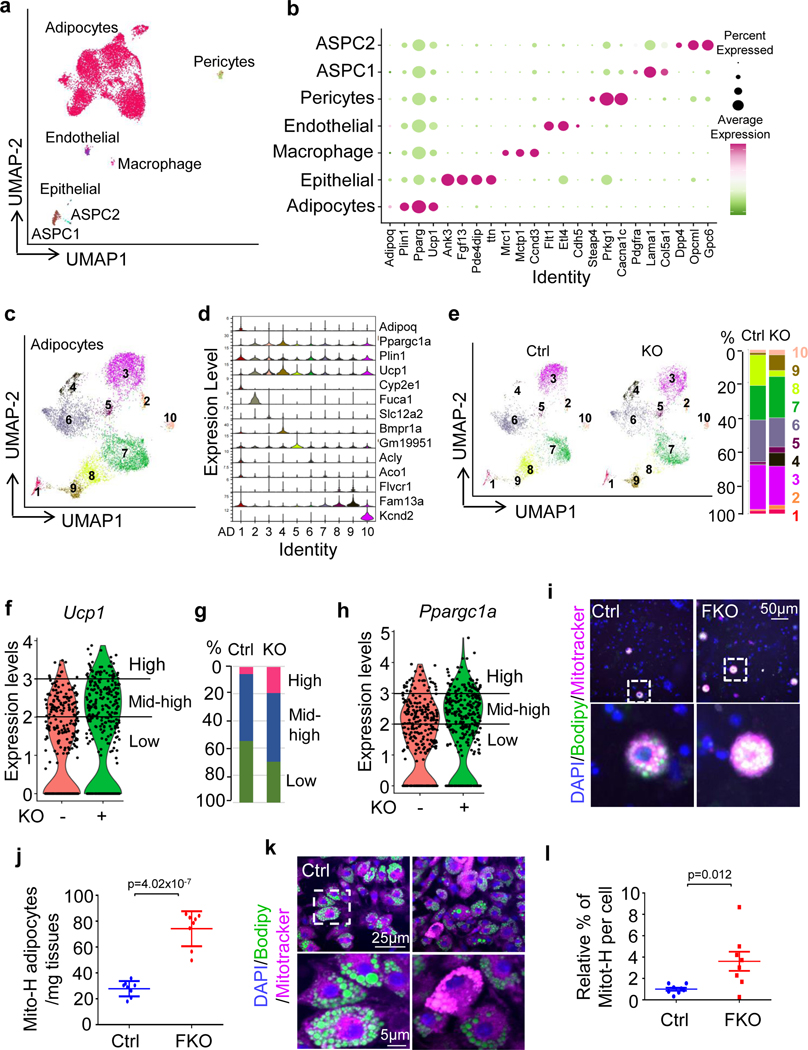
Fig. 5 |. JunB deficiency induces a shift of low-thermogenic to high-thermogenic adipocytes in BAT.
a, Uniform manifold approximation and projection (UMAP) plots and seven distinct cell clusters of BAT by unsupervised clustering. ASPC, adipose stem and progenitor cell. b, Dot plot showing the average expression of marker genes for each cluster in BAT. c, UMAP showing the ten adipocyte subpopulations formed by 8,324 nuclei (4,177 for control, 4,147 for KO). d, Violin plots for Adipoq, Ucp1, Ppargc1α and marker genes for each subpopulation of adipocytes. Expression level (y axis) refers to the log-normalized ratio of gene expression reads, normalized to the sum of all reads within each nucleus. e, UMAPs of adipocytes for control and KO BAT and the percentage of each adipocyte fraction in total adipocytes. f, Analysis of UCP1hi, UCP1int–hi and UCP1lo adiponectin-positive cells in JunB KO BAT. −, control; +, FKO. n = 5 per group. g, Quantification of UCP1hi, UCP1int–hi and UCP1lo adiponectin-positive cells in f. h, The fraction of PGC-1αhiadiponectin+ cells was increased in JunB KO BAT. i, The number of high-mitochondrial content cells in an isolated adipocyte fraction was significantly increased in JunB KO BAT. j, Quantification of mitochondriahi adipocytes in i (n = 6 per group). k, JunB deficiency increased the mitochondrial mass indicated by the fluorescence staining of MitoTracker using a high-content cell scanning system. Primary differentiated JunB KO and control brown adipocytes were incubated with 100 nM MitoTracker for 20 min.
l, Quantification of mitochondrial intensity per cell in k (n = 3, independent experiments). Data in j and l were analysed using an unpaired two-sided t-test.

