Figure 4.
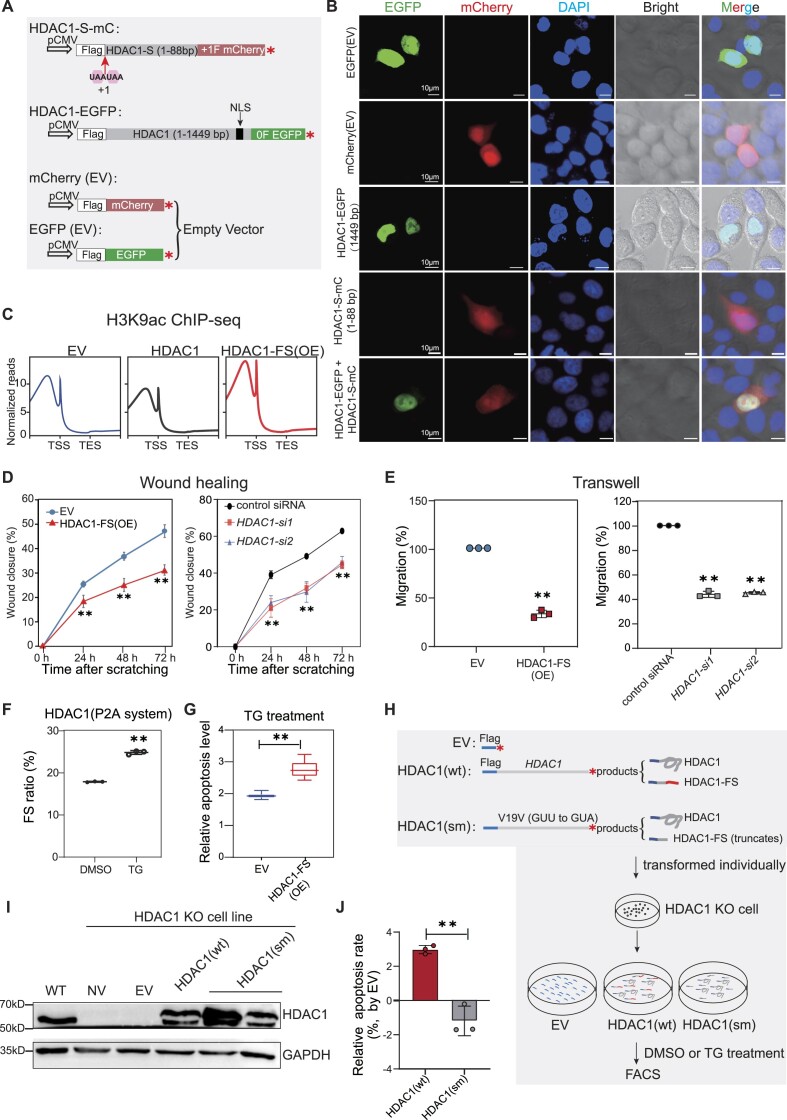
HDAC1-FS affects histone acetylation, cell migration and apoptosis. (A) Schematic diagrams of mCherry or EGFP constructs used to detect the protein localization. (B) Confocal microscopy showing subcellular localization of the HDAC1-FS and HDAC1 protein in HeLa cells with constructs shown in (A). (C) Metagene analyses of H3K9ac ChIP-seq with ectopic expression of 3× Flag-tagged HDAC1-FS, HDAC1 or empty vector (EV). (D) Wound closure assay showing the migration of A549 cells with ectopic expression of Flag-HDAC1-FS (left) and siRNA against HDAC1 (right). EV, empty vector. Error bars, standard deviation of three biological repeats. (**) P < 0.01 (one-way ANOVA). (E) Transwell assay showing the migration of A549 cells with ectopic expression of Flag-HDAC1-FS (left) and with siRNA against HDAC1 (right). EV, empty vector. Error bars, standard deviation of 3 biological repeats. (**) P < 0.01 (Student's t-test for 2 data sets and one-way ANOVA for >2 data sets). (F) Bar plot showing the changes of ribosomal frameshifting (FS) with thapsigargin (TG) or DMSO treatment of in HEK293T cells. The frameshifting ratios determined by P2A luciferase system. Error bars, standard deviation of 3 biological repeats. (**) P < 0.01(Student's t-test). (G) Apoptosis level measured by Annexin V-FITC/PI assay in thapsigargin (TG) treatment HEK293T cells. Three biological replicates were analyzed for each experiment in HEK293T cells. Error bars represent standard deviation. (**) P <0.01(Student's t-test). (H) Schematic diagram showing the experimental design for evaluating the effect of HDAC1-FS in cell apoptosis. (I) Representative western blot result detects HDAC1 protein after transformed with different constructs in wild-type (WT) HEK293T or HDAC1 KO HEK293T cells. EV, empty vector. NV, no transfection. (J) Flow cytometry analyses to TG-induced apoptosis in HEK293T cells transformed HDAC1(wt) and HDAC1(sm). Results are normalized with empty vector (EV). Error bars, standard deviation of three biological repeats. (**) P < 0.01 (Student's t-test).

