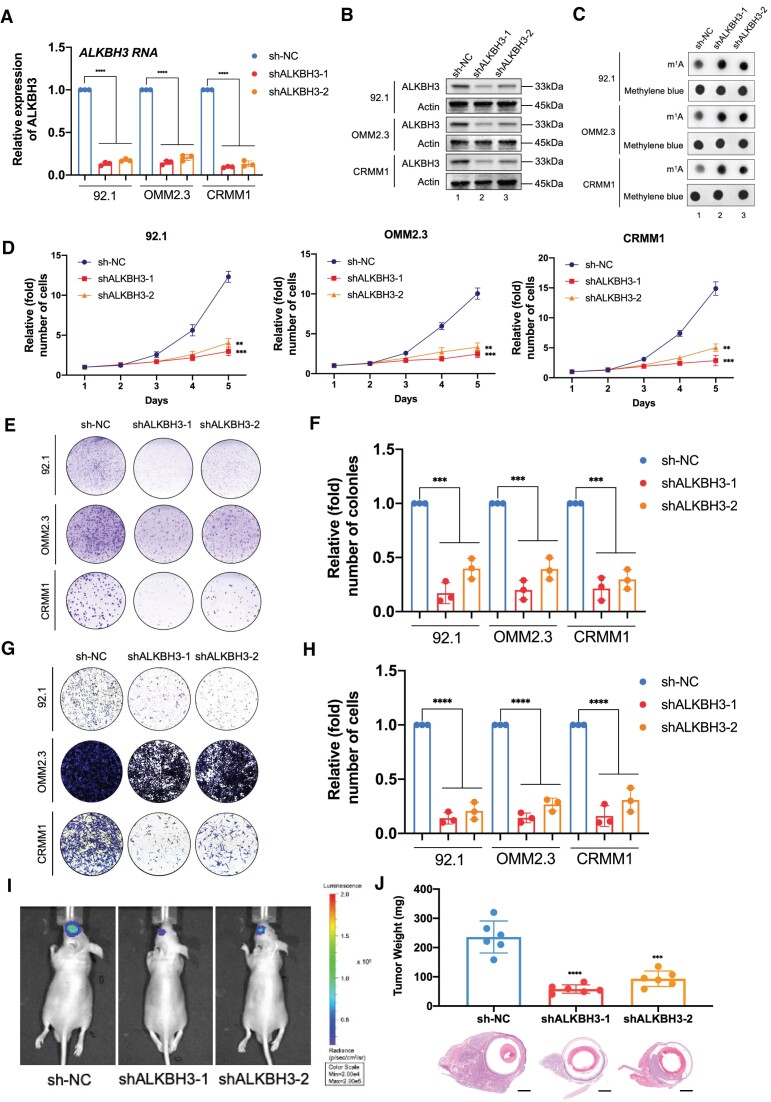
Figure 2.
ALKBH3 knockdown increased the m1A levels and suppressed ocular melanoma tumorigenesis. (A) qPCR data showing ALKBH3 expression in ocular melanoma cells (92.1, OMM2.3 and CRMM1) upon ALKBH3 knockdown. The data are presented as the mean± SD of experimental triplicates. Significance was determined by unpaired two-tailed Student's t test. ****P < 0.0001. (B) Western blot showing ALKBH3 expression relative to ACTB expression in ocular melanoma cells (92.1, OMM2.3 and CRMM1) upon ALKBH3 knockdown. (C) Dot blot showing the m1A signal relative to the methylene blue signal in ocular melanoma cells (92.1, OMM2.3 and CRMM1) upon ALKBH3 knockdown. (D) A CCK-8 assay was employed to evaluate the proliferation of ocular melanoma cells (92.1, OMM2.3 and CRMM1) upon ALKBH3 knockdown. The data are presented as the mean ± SD of experimental triplicates. Significance was determined by unpaired two-tailed Student's t test. **P < 0.01, ***P < 0.001. (E) A colony formation assay was employed to evaluate the growth of ocular melanoma cells (92.1, OMM2.3 and CRMM1) upon ALKBH3 knockdown. Representative images from three experimental replicates are shown. (F) Statistical analysis of the colony formation assay data in ocular melanoma cells (92.1, OMM2.3 and CRMM1) upon ALKBH3 knockdown. The data are presented as the mean ± SD of experimental triplicates. Significance was determined by unpaired two-tailed Student's t test. ***P < 0.001. (G) A transwell assay was employed to evaluate the migration of ocular melanoma cells (92.1, OMM2.3 and CRMM1) upon ALKBH3 knockdown. Representative images from three experimental replicates are shown. (H) Statistical analysis of the transwell assay data in ocular melanoma cells (92.1, OMM2.3 and CRMM1) upon ALKBH3 knockdown. The data are presented as the mean ± SD of experimental triplicates. Significance was determined by unpaired two-tailed Student's t test. ****P < 0.0001. (I) Images acquired with an in vivo small animal imaging system showing the suppression of bioluminescent signals in orthotopic xenografts derived from ALKBH3-deficient 92.1 cells. Representative images from six biological replicates are shown. The remaining images are provided in Supplementary Figure 1B. (J) Histograms of the weights of orthotopic xenografts derived from ALKBH3-deficient 92.1 cells. H&E staining was used to visualize tumor tissues. Representative images from six biological replicates are shown. The data are presented as the mean ± SD. Significance was determined by unpaired two-tailed Student's t test. ***P < 0.001, ****P< 0.0001. Scale bar: 200 μm.

