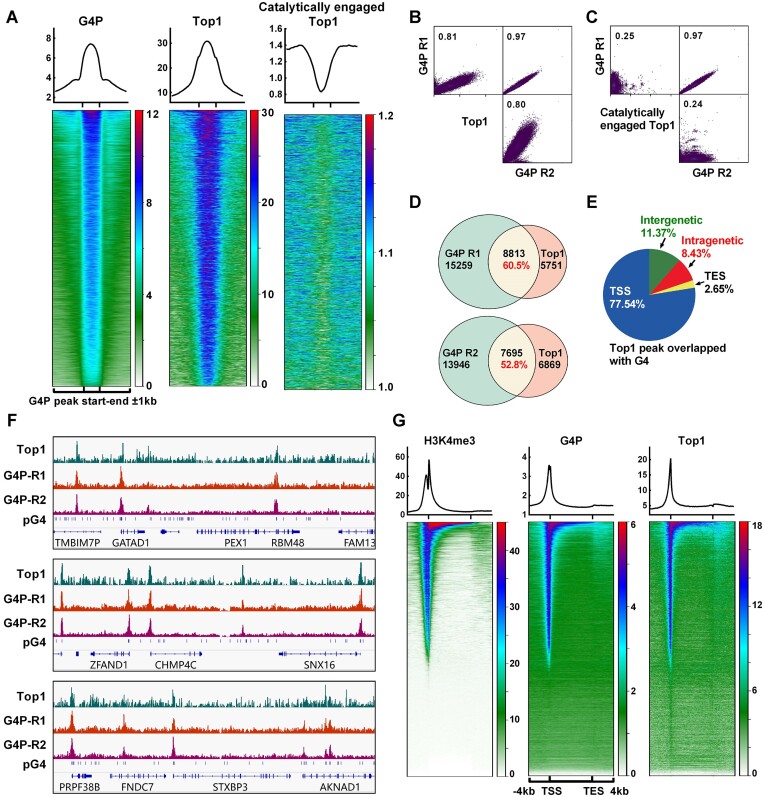
Figure 1.
Retention of Top1 on chromosomal DNA is closely associated with G4. (A) Profile (top) and heatmap (bottom) of Top1 at the G4P peak ±1 kb regions. The heatmaps were generated using the G4P peak bed file sorted based on the mean G4P reads of HCT116 cells in descending order. The data for Top1 and the catalytically engaged Top1 were obtained from NCBI GEO Datasets (GSM2058666 and GSM1385717). (B, C) Scatter plot matrices illustrate the correlation between G4P and Top1 signals. The values in the graphs represent the Pearson correlation coefficient. (D) The overlap of peaks between G4P and Top1 is shown. (E) Distribution of Top1 peaks overlapping with G4P peaks in genomic regions. (F) Examples of Top1 and G4P binding peaks on chromatin DNA. (G) Heatmap of H3K4me3, G4P, and Top1 within the ±4 kb regions around TSS-TES. The gene regions were sorted based on the mean H3K4me3 reads of HCT116 cells in descending order. ChIP-seq data for H3K4me3 was from NCBI GEO Datasets (GSM945304).

