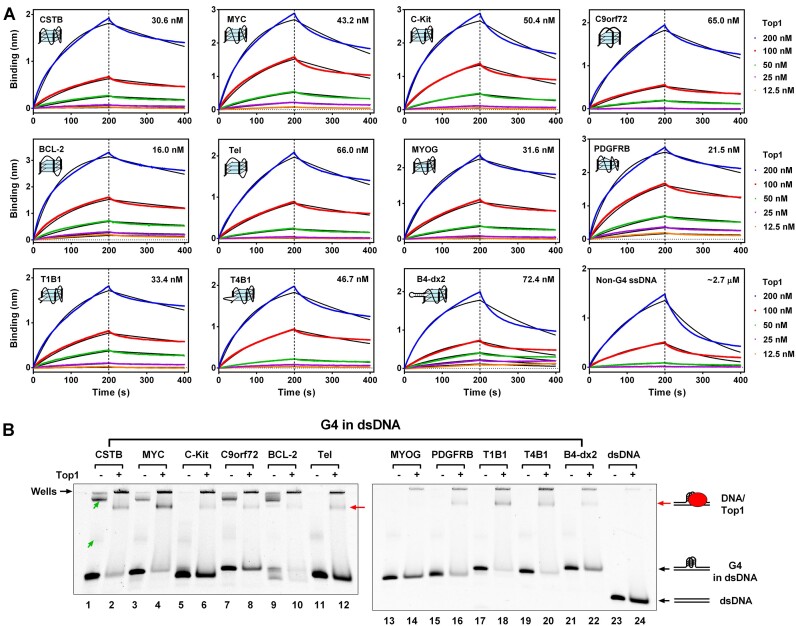
Figure 2.
Top1 Binds to G4 In Vitro. (A) Binding affinity assessment between Top1 and core G4s using biolayer interferometry (BLI). Core G4s (Supplementary Table S2) were folded from single-stranded DNA (ssDNA) containing a G-quadruplex-forming sequence and a biotin group at the 3′ end. A non-G4 ssDNA served as a control. DNAs were loaded onto streptavidin biosensor tips via the biotin group. The indicated concentrations refer to Top1 in the association phase. The association phase was 200 s, followed by a 200-s dissociation phase. Binding is represented by wavelength shift (measured in nanometers (nm)) detected by the Octet instrument. The number on the upper right side of each figure is the binding constant. (B) Evaluation of the interaction between Top1 and G4 in double-stranded DNA (dsDNA) using electrophoretic mobility shift assay (EMSA). The dsDNA containing the G-quadruplex forming sequence was not complementary to each other within the G-rich region to enable G4 formation (Supplementary Table S3). A non-G4 dsDNA served as the control. The concentrations of Top1 and DNA were 1 and 0.1 μM, respectively. The band indicated by the red arrow represents the DNA/Top1 binding complex. Bands with a slower electrophoretic migration speed indicated by the green arrows were intermolecular G4s formed between DNA strands. The bands retained in the gel wells might be the complex of intermolecular G4s and Top1 or nonspecific binding between Top1 and DNAs.

