Figure 1.
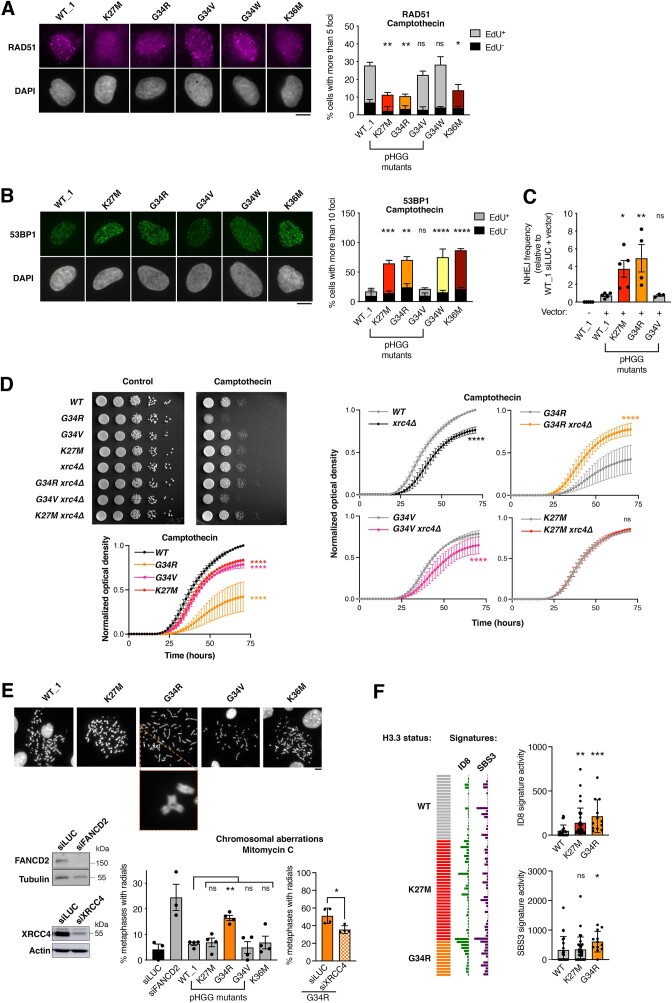
H3.3 K27M and G34R pHGG mutations hijack DNA repair in S phase and harbor genomic instability features of aberrant NHEJ. (A, B) Analysis of RAD51 (A) and 53BP1 (B) repair foci by immunofluorescence in U2OS cells stably expressing wild-type H3.3 (WT_1) or the indicated mutants and treated with camptothecin (3 h, 0.1 μM). Representative images of repair foci in EdU+ cells are shown. Bar graphs depict the percentage of EdU+ and EdU− cells harboring more than 5 (RAD51) or 10 (53BP1) foci. Mean ± SEM from two to three independent experiments, with n > 117 per sample for each experiment. (C) Analysis of NHEJ activity by random plasmid integration assay in U2OS cells stably expressing wild-type (WT_1) or mutant H3.3. Vector –, negative untransfected control. (D) Serial dilution analyses and proliferation curves of S. pombe strains expressing wild-type or mutant H3, depleted for the core NHEJ factor Xrc4 (xrc4Δ) and grown in standard growth medium (control) or in the presence of camptothecin (10 μM). Mean ± SEM from three independent experiments. (E) Scoring of radials in metaphase spreads of U2OS cells stably expressing wildtype (WT_1) or mutant H3.3 and treated with Mitomycin C (48 h, 25 ng/ml). Cells transfected with siRNA against FANCD2 (siFANCD2) and the core NHEJ factor XRCC4 (siXRCC4) are used as positive and negative controls (siLUC, siLuciferase, control). A representative example of a radial chromosome is shown in the inset. The western blots show siRNA efficiency (Tubulin, Actin, loading controls). Mean ± SEM from three to four independent experiments, with n > 24 per sample for each experiment. (F) Oncoprint representation of DNA repair-driven mutational signatures (ID8, indels 8; SBS3, single-base substitutions 3) in whole-genome sequences of pre-treatment, TP53-mutated, primary pHGG samples harboring wild-type H3.3 (WT), H3.3 K27M or G34R. Statistical significance is calculated by two-way ANOVA (A, B), one-way ANOVA (C, E), non-linear regression analysis with a sigmoidal dose-response model (D) or the non-parametric Kruskal–Wallis test (F). *P< 0.05; **P< 0.01; ***P< 0.001; ns: P> 0.05. Scale bars, 10 μm.

