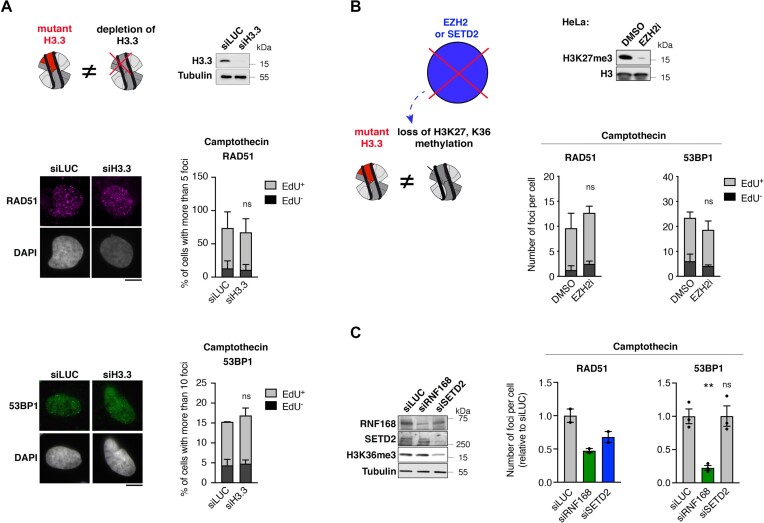
Figure 2.
pHGG H3.3 mutants hinder DNA repair through a gain-of-function mechanism independently of hypomethylation at lysines 27 and 36 of histone H3. (A) Analysis of RAD51 and 53BP1 foci by immunofluorescence in U2OS cells transfected with siRNAs against Luciferase (siLUC, control) or H3.3 (siH3.3) and treated with camptothecin (3 h, 0.1 μM). The western blot shows siRNA efficiency (Tubulin, loading control). Representative images of RAD51 and 53BP1 foci in EdU+ cells are shown. Bar graphs depict the percentage of EdU+ and EdU− cells harboring more than 5 (RAD51) or 10 (53BP1) foci. Mean ± SEM from two independent experiments, with n > 113 per sample for each experiment. (B) Analysis of RAD51 and 53BP1 foci by immunofluorescence in HeLa cells treated with DMSO or the EZH2 inhibitor GSK126 (EZH2i, 72 h, 1 μM) and damaged with camptothecin (3 h, 0.1 μM). The western blot shows the efficiency of EZH2 inhibition by analyzing H3K27me3 levels. Bar graphs depict the number of RAD51 or 53BP1 foci per cell in EdU+ and EdU− cell populations. Mean ± SEM from three independent experiments, with n > 125 per sample for each experiment. (C) Analysis of RAD51 and 53BP1 foci by immunofluorescence in U2OS cells transfected with the indicated siRNAs (siLUC, negative control; siRNF168, positive control known to inhibit both RAD51 and 53BP1 foci formation) and treated with camptothecin (3 h, 0.1 μM). siRNA efficiencies and H3K36me3 levels are analyzed by western blot (Tubulin, loading control). Bar graphs depict the mean number of RAD51 or 53BP1 foci per cell relative to siLUC. Mean ± SEM from two and three independent experiments, with n > 131 for each experiment. Statistical significance is calculated by two-way ANOVA (A, B) or one-way ANOVA (C). *P< 0.05; **P< 0.01; ***P< 0.001; ns: P> 0.05. Scale bars, 10 μm.

