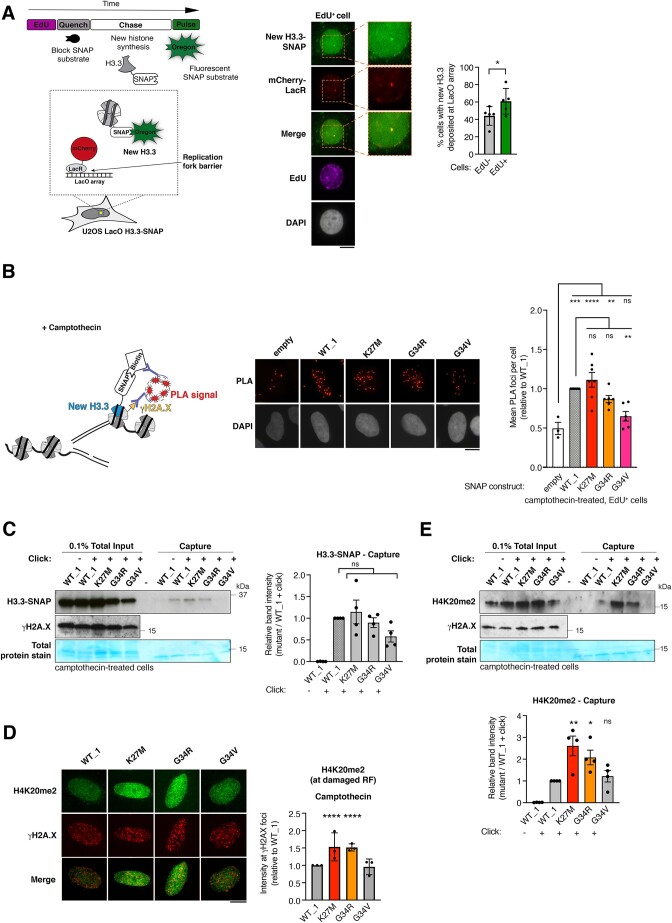
Figure 3.
H3.3 K27M and G34R pHGG mutants are de novo deposited and associated with increased H4K20me2 at damaged replication forks. (A) Scheme of the assay to monitor de novo deposition of wild-type H3.3-SNAP at the LacR-occupied LacO array fork barrier in U2OS LacO cells stably expressing SNAP-tagged H3.3 and transfected with mCherry-LacR. Images of a representative cell and 2.5× zoom on the LacO array. Quantification of new H3.3-SNAP accumulation (% cells presenting an enrichment) at LacR-occupied LacO array in EdU+ and EdU− cells. Mean ± SEM from five independent experiments, with n > 20 per sample for each experiment. The H3.3 enrichment detected in EdU-negative cells likely reflects cells that were in S phase when the mCherry-LacR was already expressed and bound to the LacO array but before EdU addition since cells were transfected 24h before harvesting. (B) Schematic representation of the SNAP-PLA assay to visualize the colocalization of γH2A.X with newly synthesized SNAP-tagged H3.3 (labeled with biotin) at RFs damaged with camptothecin (3 h, 0.1 μM). Representative images and quantification of SNAP-PLA colocalization foci between new H3.3 and γH2A.X in EdU+ U2OS cells stably expressing wild-type (WT_1) or mutant H3.3-SNAP, or SNAP tag only as a control (empty). Mean ± SEM from three to seven independent experiments, with n > 130 per sample for each experiment. (C) Western blot analysis of input and capture samples from iPOND experiments performed in U2OS cells expressing wild-type (WT_1) or mutant H3.3-SNAP, synchronized in S phase and damaged with camptothecin (1 h, 1 μM). Click -, negative control (no biotin). Total protein stain shows the position of the streptavidin monomer, detectable at similar levels in all capture samples. Bar graphs depict H3.3-SNAP band intensity in capture samples relative to WT_1. Mean ± SEM from four independent experiments. (D) Immunofluorescence analysis of H4K20me2 levels at γH2A.X foci in EdU-positive U2OS cells stably expressing wild-type (WT_1) or mutant H3.3 and treated with camptothecin (3 h, 0.1 μM). Quantification of H4K20me2 intensity relative to WT_1. Mean ± SD from three independent experiments, with n > 17 per sample for each experiment. (E) Western blot analysis of input and capture samples from iPOND experiments performed in U2OS cells expressing SNAP-tagged wild-type (WT_1) or mutant H3.3, synchronized in S phase and damaged with camptothecin (1 h, 1 μM). Click -, negative control (no biotin). Bar graphs depict H4K20me2 band intensity in capture samples relative to WT_1. Mean ± SEM from three independent experiments. Statistical significance is calculated by paired t-test (A), one-way ANOVA (B–E). *P< 0.05; **P< 0.01; ***P< 0.001; ns: p> 0.05. Scale bars, 10 μm.

