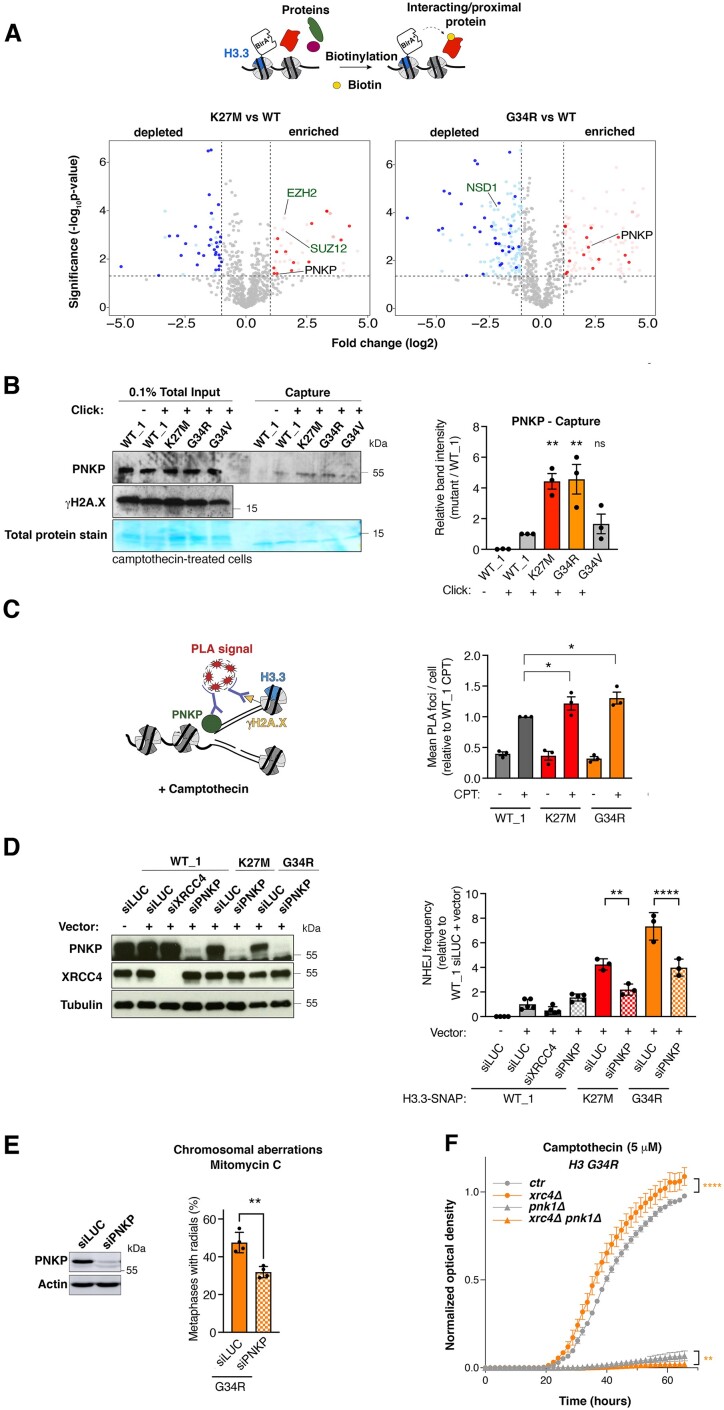
Figure 4.
PNKP mediates aberrant NHEJ in H3.3 K27M and G34R mutant cells. (A) Identification of proteins associated with wild-type (WT) and mutant H3.3 (K27M, G34R) by proximity-dependent biotinylation (BioID) in HEK293 cells expressing BirA*-tagged H3.3 proteins. Volcano plots show interactors enriched (red) or depleted (blue) in H3.3 K27M (left) or G34R (right) samples compared to WT H3.3 sample, with each dot representing an interactor. Significant interactors whose log2 fold change is >1 and whose P-value is <0.05 (–log10P-value > 1.30) are highlighted in colors and common interactors between H3.3 K27M and G34R are shown in dark colors. Positive controls are depicted in green. (B) Western blot analysis of input and capture samples from iPOND experiments performed in U2OS cells expressing wild-type (WT_1) or mutant H3.3-SNAP, synchronized in S phase and damaged with camptothecin (1 h, 1 μM). Click –, negative control (no biotin). Total protein stain shows the position of the streptavidin monomer, detectable at similar levels in all capture samples. Bar graphs depict PNKP band intensity in capture samples relative to WT_1. Mean ± SEM from three independent experiments. The representative experiment shown is the same as in Figure 3C. (C) PNKP association with CPT-damaged replication forks analyzed by PLA between PNKP and γH2A.X in EdU-positive cells. A scheme of the experiment is shown on the left. Mean ± SEM from three independent experiments. (D) Analysis of NHEJ activity by random plasmid integration assay in U2OS cells stably expressing wild-type (WT_1) or mutant H3.3 and transfected with siRNAs against Luciferase (siLUC, control) or PNKP (siPNKP). Samples siLUC–, siLUC+ and siXRCC4+ are the same shown in Figure S2I graph. Western blot analysis shows siRNA efficiency (Tubulin, loading control). Vector –, negative untransfected control. (E) Scoring of radials in metaphase spreads of U2OS H3.3 G34R cells transfected with siRNA against Luciferase (siLUC, control) or PNKP (siPNKP) and treated with Mitomycin C (48 h, 25 ng/ml). The western blot shows siRNA efficiency (Actin, loading control). Mean ± SEM from four independent experiments, with n > 24 per sample for each experiment. (F) Proliferation curves of S. pombe strains expressing H3G34R, depleted for the core NHEJ factor Xrc4 (xrc4Δ) and for Pnk1 (pnk1Δ) and grown in the presence of camptothecin (5 μM). Statistical significance is calculated by one-way ANOVA (B–D), by non-linear regression analysis with a sigmoidal dose-response model (D). *P< 0.05; **P< 0.01; ***P< 0.001; ns: P> 0.05.

