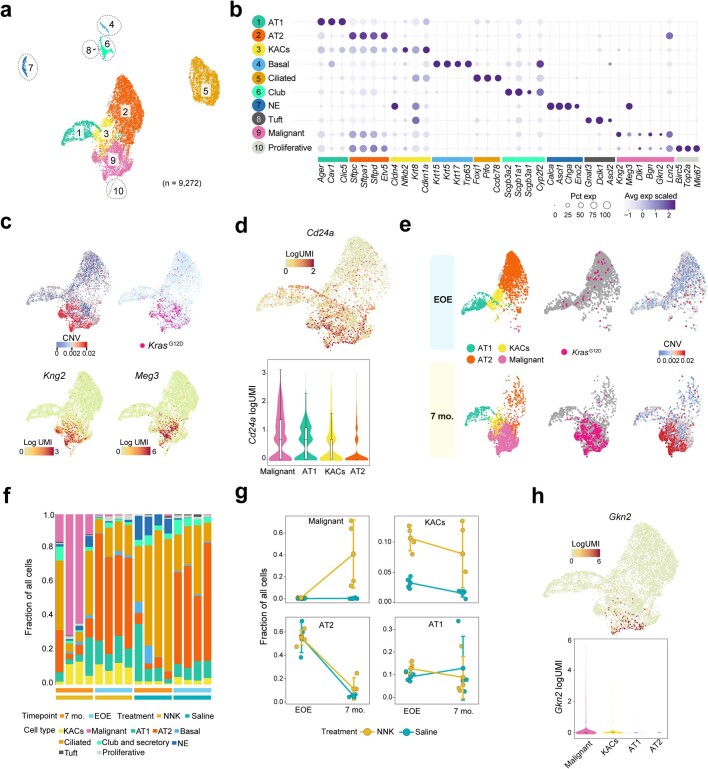
Extended Data Fig. 7. scRNA-seq analysis of epithelial subsets in a tobacco carcinogenesis mouse model of KM-LUAD.
a, UMAP distribution of mouse epithelial cell subsets. b, Proportions and average expression levels of select marker genes for mouse normal epithelial cell lineages and malignant cell clusters as defined in panel a. c, UMAP plots of alveolar and malignant cells coloured by CNV score, presence of KrasG12D mutation, or expression levels of Kng2 and Meg3. d, UMAP (top) and violin (bottom) plots showing expression level of Cd24a in malignant and alveolar subsets. Box-and-whisker definitions are similar to Extended Data Fig. 1f. n cells in each group: Malignant = 1,693; AT1 = 580; KACs = 636; AT2 = 1,791. e, UMAP distribution of alveolar and malignant cells coloured by cell lineage, KrasG12D mutation status, and CNV score at EOE or 7 months following NNK. f, Proportions of normal epithelial cell lineages and malignant cells in each sample. g, Fractional changes of malignant cells, KACs, AT2 and AT1 cells between EOE and 7 months post treatment with NNK or saline; n = 4 biologically independent samples in each group. Whiskers, 1.5× interquartile range; Center dot: median. h, UMAP (top) and violin (bottom) plots showing expression levels of Gkn2 in malignant and alveolar cell subsets. n cells in each group: Malignant = 1,693; AT1 = 580; KACs = 636; AT2 = 1,791.

