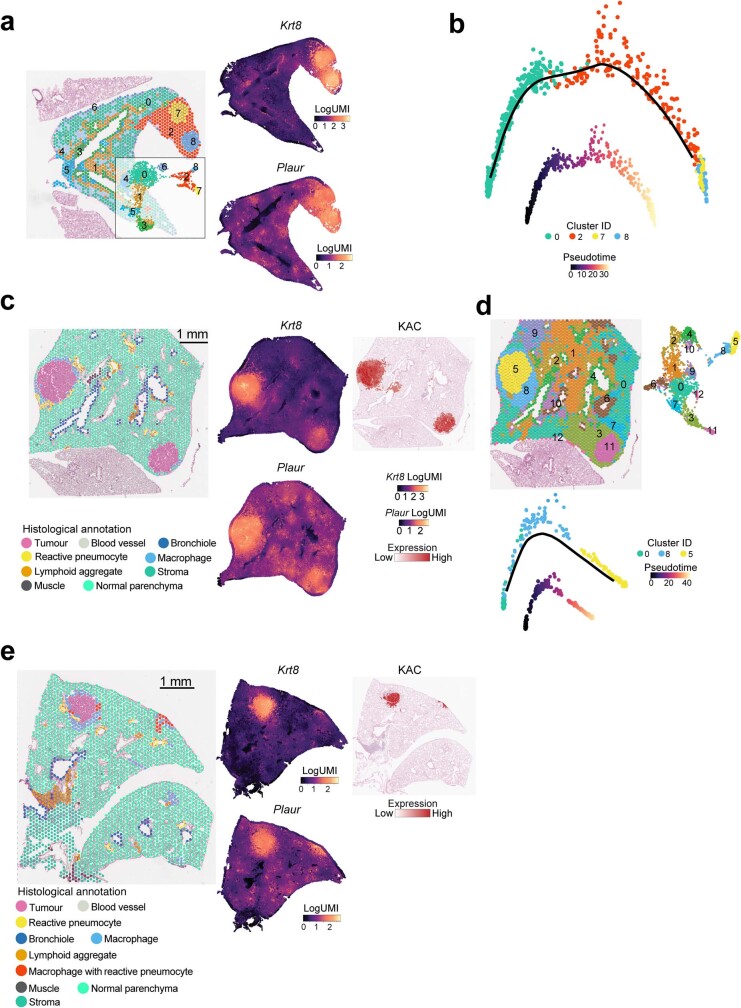
Extended Data Fig. 8. ST analysis of KACs in tobacco-associated development of KM-LUAD.
a, ST analysis of the same tumour-bearing mouse lung in Fig. 3e with cell clusters identified by Seurat (inlet) and mapped spatially (left). Spatial maps with scaled expression of Krt8 and Plaur are shown on the right. b, Pseudotime trajectory analysis of C0 (alveolar parenchyma), C2 (reactive area with KACs nearby tumours), and clusters C7 and C8 (representing two tumours) from the same tumour-bearing mouse lung in a. c, ST analysis of another tumour-bearing lung region from the same NNK-exposed mouse as in panel a, and showing histological spot-level annotation of H&E-stained images (left) followed by spatial maps with scaled expression of Krt8, Plaur, and KAC signature (right). d, Cell clusters identified by Seurat (top left) and mapped spatially (top right) from the same mouse tumour-bearing lung in c. bottom of panel k: Pseudotime trajectory analysis of C0 (alveolar parenchyma), C8 (reactive area with KACs nearby the tumour), and C5 (representing one tumour) from the mouse tumour-bearing lung in c. e, ST analysis of a tumour-bearing lung from an additional mouse at 7 months following NNK showing histological spot-level annotation of H&E-stained images (left) followed by spatial maps with scaled expression of Krt8 (middle, top), Plaur (middle, bottom), and KAC signature (right).

