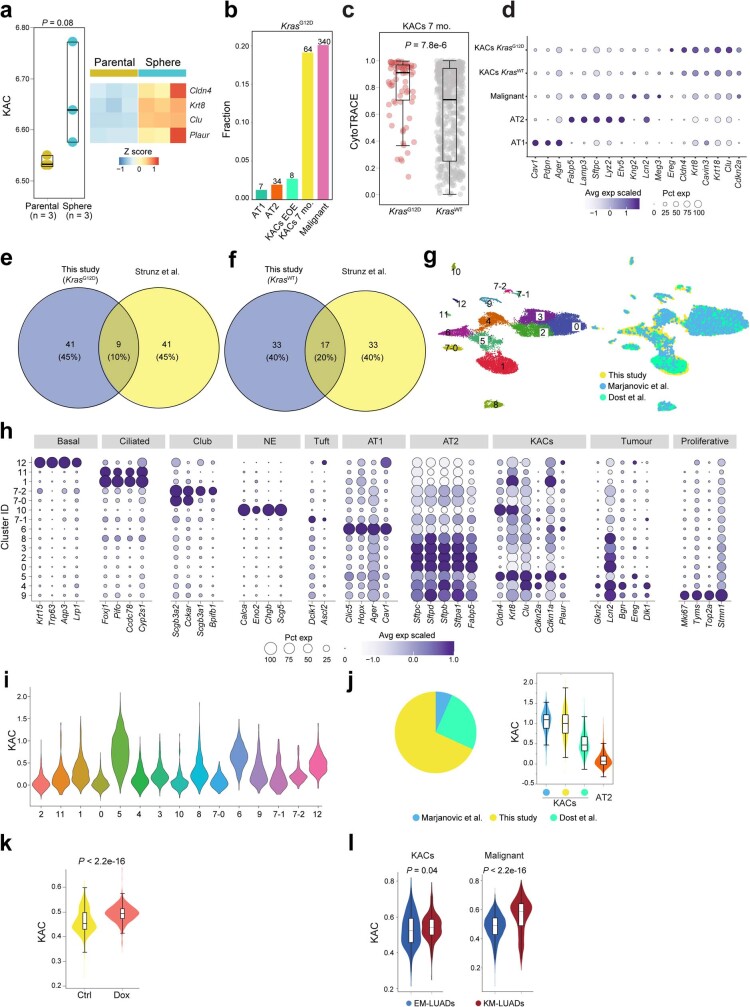
Extended Data Fig. 10. Mouse KACs exist in a continuum, bear strong resemblance to human KACs, and are present in independent KRASG12D-driven mouse models of LUAD.
a, Mouse KAC signature score (left) and heatmap showing expression of select KAC marker genes (right) in bulk transcriptomes of MDA-F471-derived 3D spheres versus parental MDA-F471 cells grown in 2D. P value was calculated using two-sided Wilcoxon Rank-Sum test. Box-and-whisker definitions are similar to Extended Data Fig. 1f. b, Fraction of KrasG12D mutant cells in different mouse alveolar cell subsets including when separating KACs into early KACs at EOE and late KACs at 7 months following NNK. Numbers of KrasG12D mutant cells are indicated on top of each bar. c, CytoTRACE scores in late KACs with KrasG12D mutation and in those with wild type KRAS (Kraswt). P value was calculated using two-sided Wilcoxon Rank-Sum test. Box-and-whisker definitions are similar to Extended Data Fig. 1f. n cells in each box-and-whisker: KrasG12D = 72; Kraswt = 564. d, Proportions and average expression levels of select marker genes for the different subsets indicated. Pie charts showing percentages of unique and overlapping DEG sets between Krt8+ transitional cells identified by Strunz and colleagues and either KrasG12D (e) or Kraswt (f) KACs from this study. g, UMAP clustering of cells integrated from our mouse cohort with cells in the scRNA-seq datasets from studies by Marjanovic et al. and Dost et al. h, Proportions and average expression levels of select marker genes for diverse alveolar and tumour cell subsets and across clusters defined in panel g with cluster 5 (C5) shown to be enriched with KAC markers. i, KAC signature expression across clusters defined in panel g. n cells in each cluster: 2 = 2,463; 11 = 154; 1 = 3,480; 0 = 4,396; 5 = 1,362; 4 = 1,513; 3 = 2,392; 10 = 219; 8 = 577; 7-0 = 382; 6 = 1,042; 9 = 285; 7-1 = 141; 7-2 = 115; 12 = 119. j, Distribution of cells from C5 across the three indicated cohorts (left). KAC signature enrichment across KACs from the three cohorts and relative to pooled AT2 cells (right). Box-and-whisker definitions are similar to Extended Data Fig. 1f. n cells in each box-and-whisker: KACs, Marjanovic et al = 90; This study = 485; Dost et al = 343; AT2 = 3,762. k, KAC signature score in human AT2 cells with induced expression of KRASG12D (Dox) relative to KRASwt cells (Ctrl) from the Dost et al. study. Dox: Doxycycline. Box-and-whisker definitions are similar to Extended Data Fig. 1f. n cells in each box-and-whisker: Ctrl = 802; Dox = 1,341. P value was calculated using two-sided Wilcoxon Rank-Sum test. l, Mouse KAC signature expression in KACs (left) and malignant cells (Malignant, right) from KM-LUADs relative to EM-LUADs in our human scRNA-seq dataset. Box-and-whisker definitions are similar to Extended Data Fig. 1f. n cells in each box-and-whisker: KACs, EM-LUADs = 135; KACs, KM-LUADs = 719; Malignant, EM-LUADs = 5,457; Malignant, KM-LUADs = 2,472. P values were calculated using two-sided Wilcoxon Rank-Sum test.

