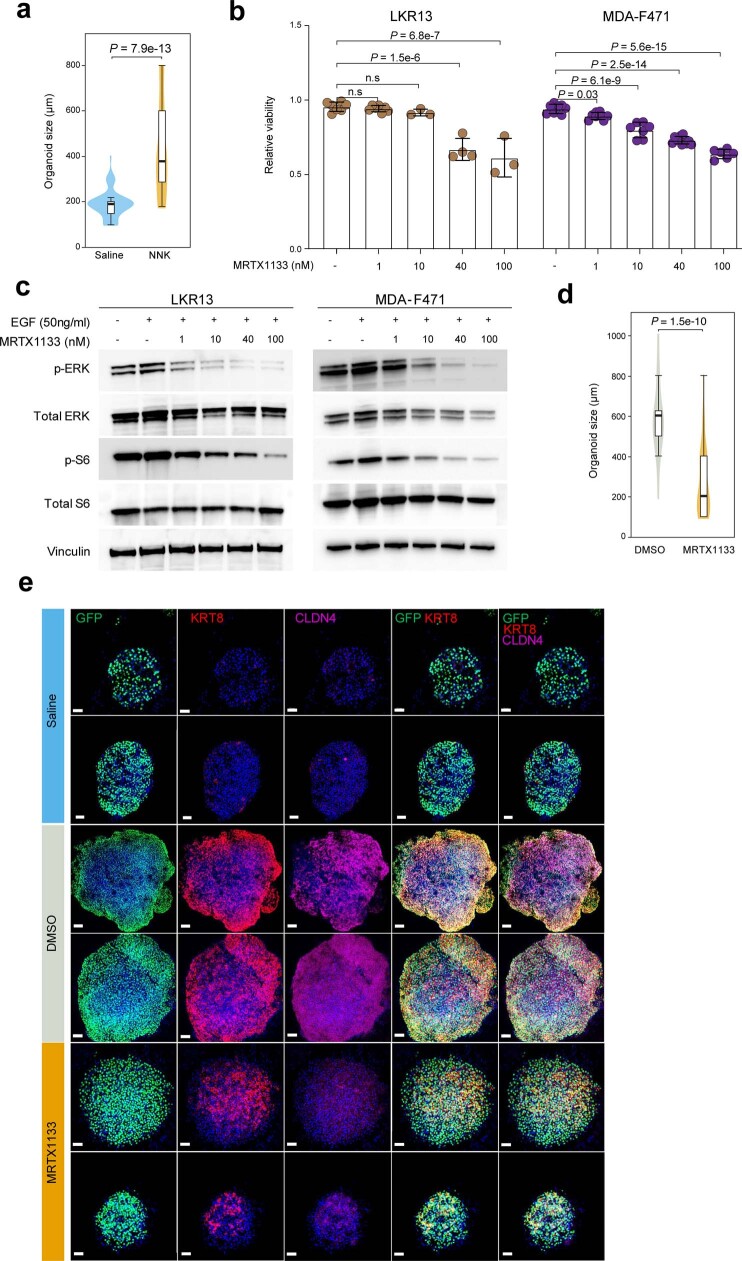
Extended Data Fig. 12. KAC-rich organoids are sensitive to targeted inhibition of KRAS.
a, Size quantification of organoids derived from GFP+ lungs cells of mice treated with saline (derived from 10 mice and plated into 4 wells) or NNK (derived from 13 mice and plated into 12 wells) at 3 months post-exposure. Box-and-whisker definitions are similar to Extended Data Fig. 1f. n organoids in each group: Saline = 63; NNK = 66. P value was calculated using two-sided Wilcoxon Rank-Sum test. b, Analysis of relative viability 4 days post treatment of LKR13 and MDA-F471 cells following treatment with increasing concentrations of MRTX1133. n samples in each group of LKR13 cells: - = 7; 1 = 7; 10 = 3; 40 = 4; 100 = 3. n samples in each group of MDA-F471 cells: - = 8; 1 = 8; 10 = 7; 40 = 11; 100 = 6. n.s: non-significant (P > 0.05). Error-bars: standard deviations of means. P values were calculated using an ordinary one-way ANOVA with Dunnett’s post-test. Results are representative of two independent experiments. c, Western blot analysis for the indicated proteins and phosphorylated proteins at 3 h post-treatment to EGF without or with increasing concentrations of the KRASG12D inhibitor MRTX1133 (from Mirati Therapeutics, Inc.). Proteins were run on additional gels (4 per cell line) to separately blot with antibodies against phosphorylated and total forms of each of the indicated proteins (Supplementary Fig. 9). Vinculin protein levels were analysed as loading control for each gel whereby four LKR13 and four MDA-F471 blots are shown in Supplementary Fig. 9. For lysates from each of the two cell lines, vinculin blots from Gel 1 (Supplementary Fig. 9) are selected and shown in this figure panel. Uncropped images of western blots with molecular weight ladder are also shown in Supplementary Fig. 9. Results are representative of three independent experiments. EGF: epidermal growth factor. d, Size quantification of organoids derived from GFP+ lungs cells of NNK-treated AT2 reporter mice and treated with 200 nM MRTX1133 or control DMSO in vitro (n = 6 wells per condition). Box-and-whisker definitions are similar to Extended Data Fig. 1f. n samples (organoids) in each group: DMSO = 38; MRTX1133 = 53. P value was calculated using two-sided Wilcoxon Rank-Sum test. e, IF analysis showing representative organoids derived from sorted GFP+ cells from AT2 reporter mice that were exposed to saline (top two rows; n = 4 wells) or exposed to NNK and then treated ex vivo with DMSO (middle two rows; n = 6 wells) or 200 nM MRTX1133 (bottom two rows; n = 6 wells). Scale bars = 50 μm except for the first DMSO-treated organoid (third row) whereby scale bar = 100 μm. Staining was repeated three times with similar results.

