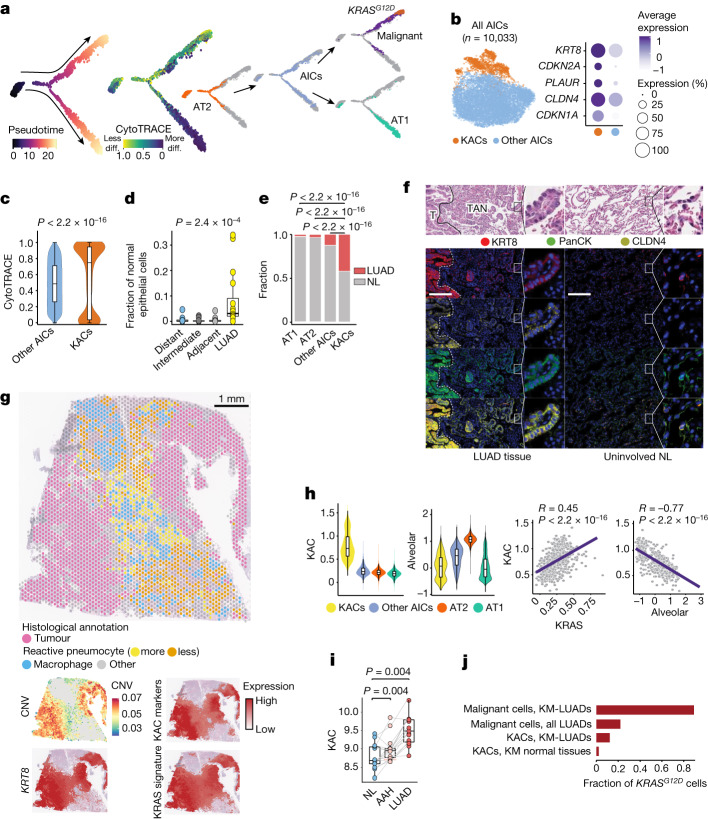
Fig. 2. Identification and characterization of KACs in human LUAD.
a, Pseudotime analysis of alveolar and malignant cells. b, Left, subclustering analysis of AICs. Right, proportions and average expression levels (scaled) of representative KAC marker genes. c, CytoTRACE score in KACs versus other AICs. n cells (left to right): 8,591 and 1,440. P value was calculated using two-sided Wilcoxon rank-sum test. d, Proportion of KACs among non-malignant epithelial cells. n samples (left to right): 16, 15, 16 and 16. P value was calculated using Kruskal–Wallis test. e, Fraction of alveolar cell subsets coloured by sample type. P values were calculated using two-sided Fisher’s exact tests with Benjamini–Hochberg correction. f, Top, haematoxylin and eosin (H&E) staining of LUAD tumour (T), TAN displaying reactive hyperplasia of AT2 cells and uninvolved NL tissue. Bottom, digital spatial profiling showing KRT8, PanCK, CLDN4, Syto13 blue nuclear stain and composite image. Magnification, ×20. Scale bar, 200 μm. Staining was repeated four times with similar results. Dashed white lines represent the margins separating tumours and TAN regions. g, ST analysis of LUAD from patient P14 showing histologically annotated H&E-stained Visium slide (left) and spatial heatmaps (right) depicting CNV score and scaled expression of KRT8, KAC markers (b) and KRAS signature. h, Expression (top) and correlation (bottom) analyses of KAC, KRAS and alveolar signatures. n = 1,440 (KACs), 8,593 (other AICs), 146,776 (AT2) and 25,561 (AT1). R, Spearman’s correlation coefficient. P values were calculated using Spearman’s correlation test. i, KAC signature expression in premalignancy cohort (15 samples each). P values were calculated using two-sided Wilcoxon signed-rank test with Benjamini–Hochberg correction. j, Fraction of KRASG12D cells in different subsets. For c,d,h and i, box-and-whisker definitions are the same as Fig. 1g.

