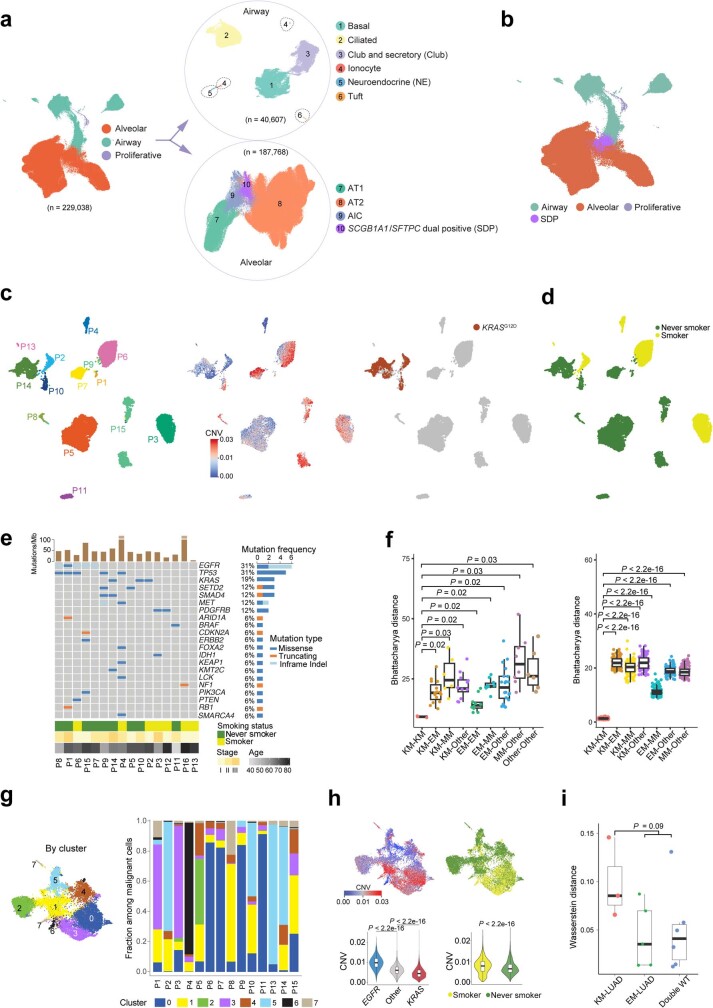
Extended Data Fig. 1. Analysis of normal lung epithelial and malignant subsets in early-stage LUADs.
a,b, UMAP plots of 229,038 normal epithelial cells from 63 samples. Each dot represents a single cell coloured by major cell lineage (a, left), airway sub-lineage (a, top right) and alveolar sub-lineages (a, bottom right). SCGB1A1/SFTPC dual positive cells (SDP) cells were separately coloured to show their position on the UMAP (b). c,d UMAP plots of 17,064 malignant cells coloured by patient ID (c, left), CNV score (c, middle), presence of KRASG12D mutation (c, right) and smoking status (d). e, Analysis of recurrent driver mutations identified by WES. f, Transcriptomic variances quantified by Bhattacharyya distances at the sample (left) and cell (right) levels among LUADs with driver mutations in KRAS (KM), EGFR (EM), and MET (MM), or LUADs that are wild type (WT) for these genes. Box, median ± interquartile range; whiskers, 1.5× interquartile range; centre line: median. n cells in each box-and-whisker in the left panel: KM-KM = 3; KM-EM = 15; KM-MM = 6; KM-Other = 12; EM-EM = 10; EM-MM = 10; EM-Other = 20; MM-Other = 8; Other-Other = 6. n cells in each box-and-whisker in the right panel: 100. P values were calculated by two-sided Wilcoxon Rank-Sum test with a Benjamini–Hochberg correction. g, Harmony-corrected UMAP plot of malignant cells coloured by cluster ID (left) and cluster distribution by sample (right). h, UMAP plots of malignant cells coloured by CNV scores (top left), smoking status (top right). Comparison of CNV scores between malignant cells from samples carrying different driver mutations (bottom left) or between smokers and never smokers (bottom right). Box-and-whisker definitions are similar to panel f. n cells in each box-and-whisker: EGFR = 5,457; Other = 9,135; KRAS = 2,472; Smoker = 5,999; Never smoker = 11,065. P values were calculated by two-sided Wilcoxon Rank-Sum test with a Benjamini–Hochberg correction. i, Analysis of Wasserstein distances among KM-LUADs, EM-LUADs, and LUADs with WT KRAS and EGFR (Double WT). Box-and-whisker definitions are similar to panel f. n samples in each box-and-whisker: 3; 5; 6. P value was calculated by a two-sided Wilcoxon Rank-Sum test.

