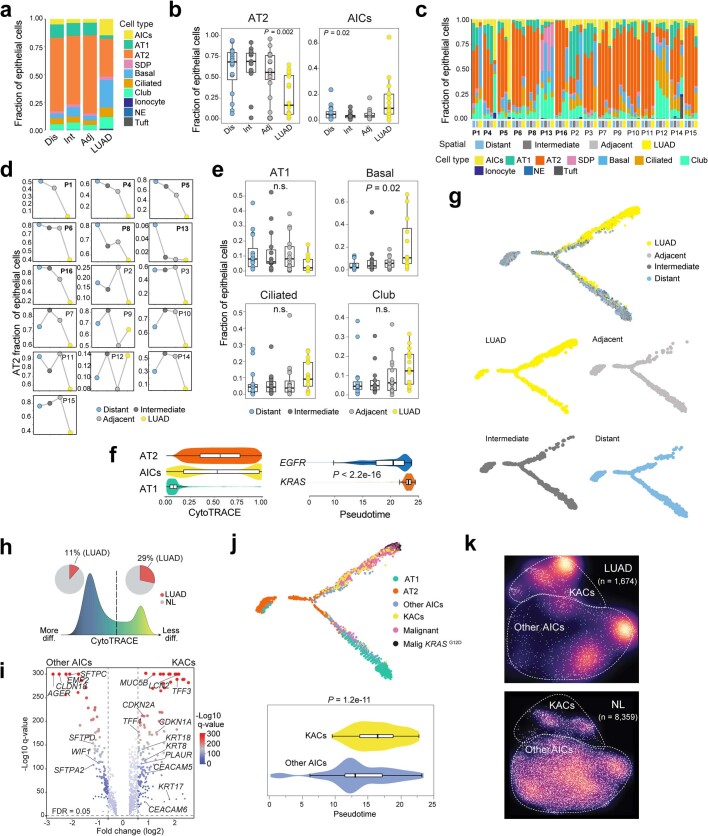
Extended Data Fig. 3. Phenotypic diversity and states of human normal lung epithelial cells.
a, Composition of normal epithelial lineages across spatial regions as defined in Fig. 1a. Dis: distant normal. Int: intermediate normal. Adj: adjacent normal. NE: neuroendocrine. b, Changes in cellular fractions of AT2 cells (left) and AICs (right) across the spatial samples. Box-and-whisker definitions are similar to Extended Data Fig. 1f. n samples in each box-and-whisker (left to right): 16; 15; 16; 16. P values were calculated with Kruskal-Wallis test. c, Composition of normal epithelial lineages across the spatial regions at the sample level. d, Fractional changes of AT2 cells among all epithelial cells across the spatial regions at the patient level. c and d: Cases showing gradually reduced AT2 fractions with increasing tumour proximity (7 of the 16 patients; P = 0.004 by ordinal regression analysis in d). e, Fractions of AT1, basal, ciliated, and club and secretory cells along the continuum of the spatial samples. Box-and-whisker definitions are similar to Extended Data Fig. 1f. n samples in each box-and-whisker (left to right): 16; 16; 15; 16. P values were calculated with Kruskal-Wallis test. f, Distribution of CytoTRACE scores in AICs, AT1 and AT2 cells (left). Distribution of pseudotime scores in malignant cells from EGFR- or KRAS-mutant tumours (right). P value was calculated with two-sided Wilcoxon Rank-Sum test. Box-and-whisker definitions are similar to Extended Data Fig. 1f with n cells: AT2 = 14,649; AICs = 974; AT1 = 2,529; EGFR = 1,711; KRAS = 1,326. g, Pseudotime trajectory analysis of alveolar and malignant subsets coloured by tissue location. h, Distribution and composition of AICs with low (left) or high (right) CytoTRACE score. i, DEGs between KACs and other AICs. j, Pseudotime trajectory analysis of malignant and alveolar subsets colour-coded by cell lineage and presence of KRASG12D mutation (top). Pseudotime score in KACs versus other AICs (bottom). Box-and-whisker definitions are similar to Extended Data Fig. 1f. n cells in each box-and-whisker: KACs = 157; Other AICs = 817. P value was calculated by two-sided Wilcoxon Rank-Sum test. k, Differences in cell densities between LUAD (top) and NL tissues (bottom).

