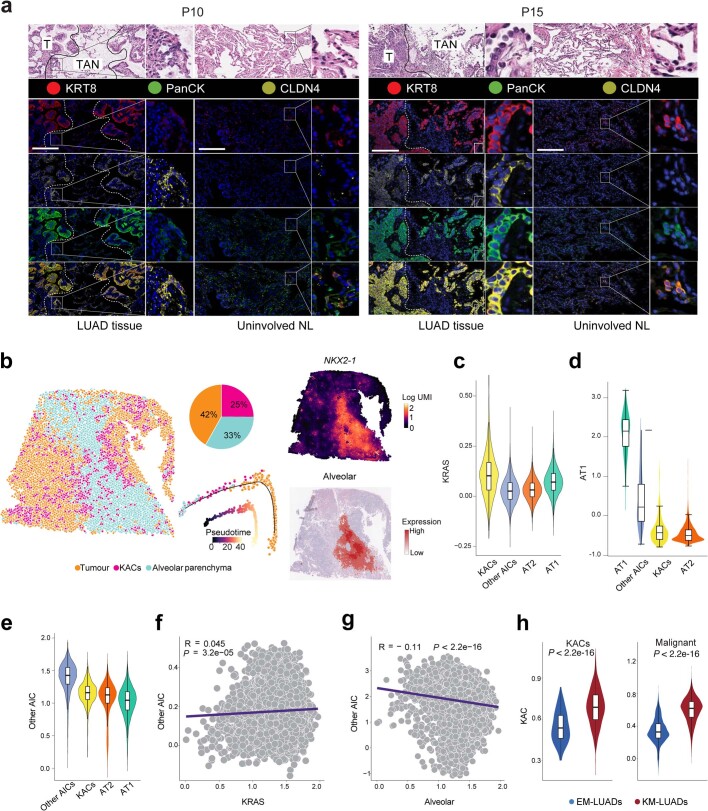
Extended Data Fig. 4. Spatial and molecular attributes of human KACs.
a, Microphotographs of P10 (left) and P15 (right) LUAD and paired uninvolved NL tissues. Top panels: H&E staining showing LUAD T and TAN (left columns) regions, and uninvolved NL (right columns). DSP analysis of KRT8 (red), CLDN4 (yellow), and pan-cytokeratin (PanCK; green) in LUAD, TAN, and NL regions. Blue nuclear staining was done using Syto13. Magnification, ×20. Scale bar = 200 μm. Staining was repeated four times with similar results. b, CytoSPACE deconvolution and trajectory analysis of P14 LUAD ST data. The left spatial map is coloured by deconvoluted cell types. Top middle panel shows the neighbouring cell composition of KACs, and the bottom middle panel depicts inferred trajectory and pseudotime prediction using Monocle 2. Scaled expression of NKX2-1 and alveolar signature are shown in the rightmost top and bottom panels, respectively. c–e, Expression of KRAS (c), AT1 (d), and other AIC (e) signatures across AT1, AT2, KACs and other AICs. Box-and-whisker definitions are similar to Extended Data Fig. 1f. n cells in each group: KACs = 1,440; Other AICs = 8,593; AT2 = 146,776; AT1 = 25,561. f, g, Correlation analysis between Other AIC and KRAS (f) or alveolar (g) signature scores. P values were calculated with Spearman correlation test. R denotes the Spearman correlation coefficients. h, Enrichment of KAC signature among KACs (left) and malignant cells (right) from KM- or EM-LUAD samples. Box-and-whisker definitions are similar to Extended Data Fig. 1f. n cells in each box-and-whisker (left to right): KACs, EM-LUADs = 135; KACs, KM-LUADs = 719; Malignant, EM-LUADs = 5,457; Malignant, KM-LUADs = 2,472. P values were calculated by two-sided Wilcoxon Rank-Sum test.

