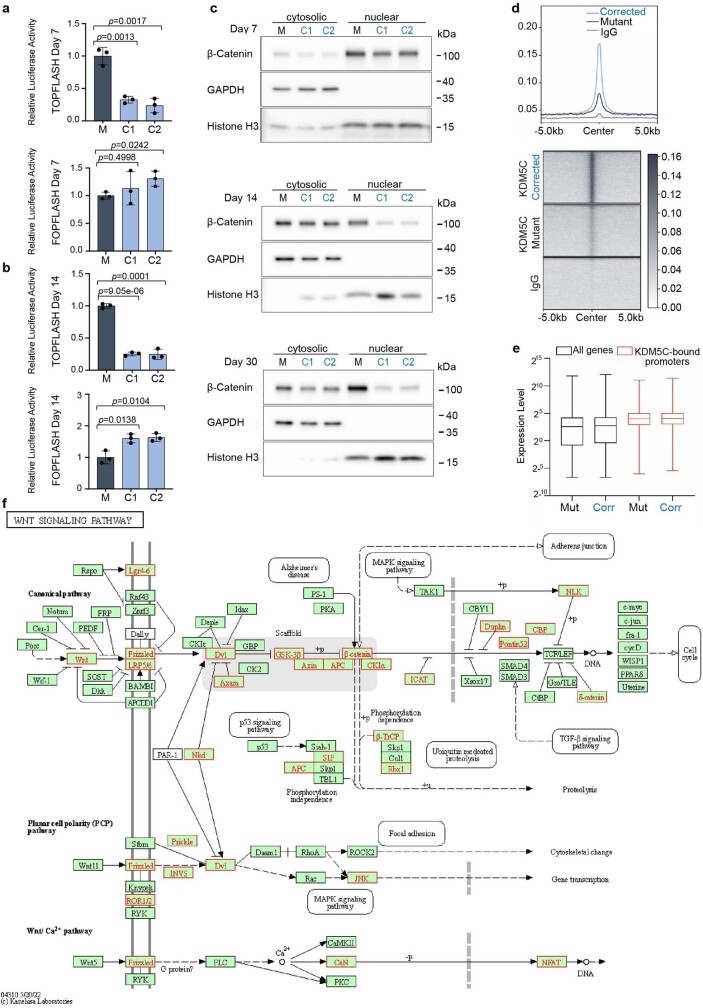
Extended Data Fig. 6. KDM5C binds directly to Wnt signaling genes.
a, The relative luciferase activity in Mutant and Corrected cells (C1 and C2) transfected with Top-flash and Fop-flash vectors at day 7 and (b) day 14 of neuronal differentiation. Data are represented as mean ± SD of 3 independent experiments. The p-values by two-tailed unpaired Student’s t-test are indicated. P < 0.05 was considered statistically significant. Abbreviations: M=Mutant; C1 and C2=Corrected 1 and Corrected 2. c, Western blotting of nuclear and cytoplasmatic fractions isolated from Mutant and Corrected lines of brother 1 at day 7, 14 and 30 of neuronal differentiation. GAPDH and Histone H3 were used to mark the cytosolic and nuclear fraction respectively. β-Catenin expression in the cytoplasm and nucleus is indicated. 3 independent experiments were performed with similar results. GAPDH, Histone H3 and β-Catenin were run on the same gel. For gel source data see Supplementary Fig. 1. d, Profile plot and heat map of KDM5C enrichment at the 4,526 KDM5C peaks called in Corrected cells. e, Box plot representing gene expression levels in Mutant (Mut) and Corrected (Corr) cells for all genes and KDM5C bound promoters. Bounds of box indicate 25th and 75th percentiles. Centre line denotes median and bounds of whiskers indicate minima and maxima values. f, KEGG pathway highlighting genes in the Wnt signaling pathway directly bound by KDM5C (KEGG (hsa04310)). Genes directly bound by KDM5C are marked in red.

