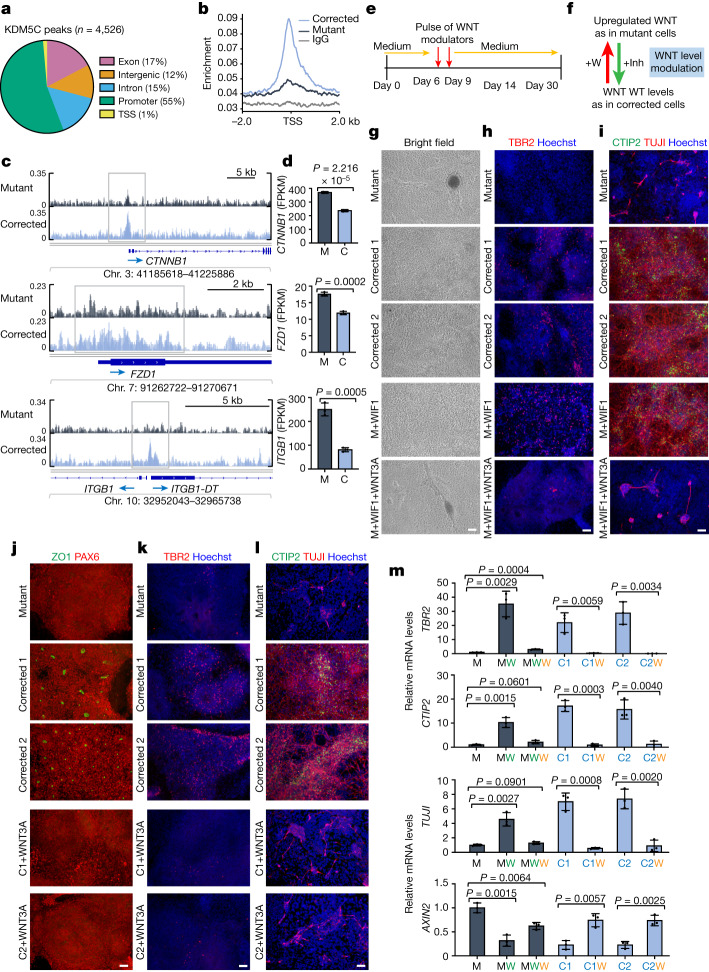
Fig. 3. Delayed neuronal differentiation was mimicked or rescued by transient WNT–β-catenin modulation.
a, Genomic distribution of KDM5C-binding events in corrected cells (CUT&RUN analysis on day 16). TSS, transcription start site. b, KDM5C enrichment profiles at promoter regions of genes. c, Integrative genomic viewer (IGV) snapshot of KDM5C-binding peaks at WNT-associated genes. d, Fragments per kilobase of transcript per million fragments mapped (FPKM) expression values extracted from RNA-seq data at day 16 for the presented WNT-associated genes. e, Scheme of the treatment strategy. Compounds were added on day 6 and day 9. On day 12, cells were washed and supplied with standard medium (Medium) that does not contain compounds. f, Schematic of the goal of treatment. Addition of WNT3A (+W) to corrected cells aimed to mimic WNT levels observed in mutant cells, surpassing WT levels that were considered optimal. Addition of a WNT inhibitor (+Inh) sought to reduce WNT to WT levels in mutant cells. g–i, Brightfield images (g) and immunofluorescence images of TBR2 (h) and for CTIP2 and TUJI (i) in mutant cells and corrected cells at day 30, which were treated transiently with vehicle (mutant (M), corrected 1 and corrected 2), WIF1 (1 µg ml–1; M+WIF1) or a combination of WIF1 (1 µg ml–1) and WNT3A (200 ng ml–1) (M+WIF1+WNT3A). j–l, Immunofluorescence analyses at day 30 of ZO1 and PAX6 (j), TBR2 (k) and CTIP2 and TUJI (l) and Hoechst. Corrected clones (C1 and C2) were transiently treated with recombinant WNT3A. m, qPCR analyses of TBR2, CTIP2, TUJI and AXIN2 mRNA levels at day 30. Green W, WIF1; orange W, WNT3A. For d and m, data represent the mean ± s.d. of three independent experiments. P values were calculated using two-tailed unpaired Student’s t-test; P < 0.05 was considered significant. For g–l, more than three independent experiments were performed with similar results. Scale bars, 100 µm (g–l).

