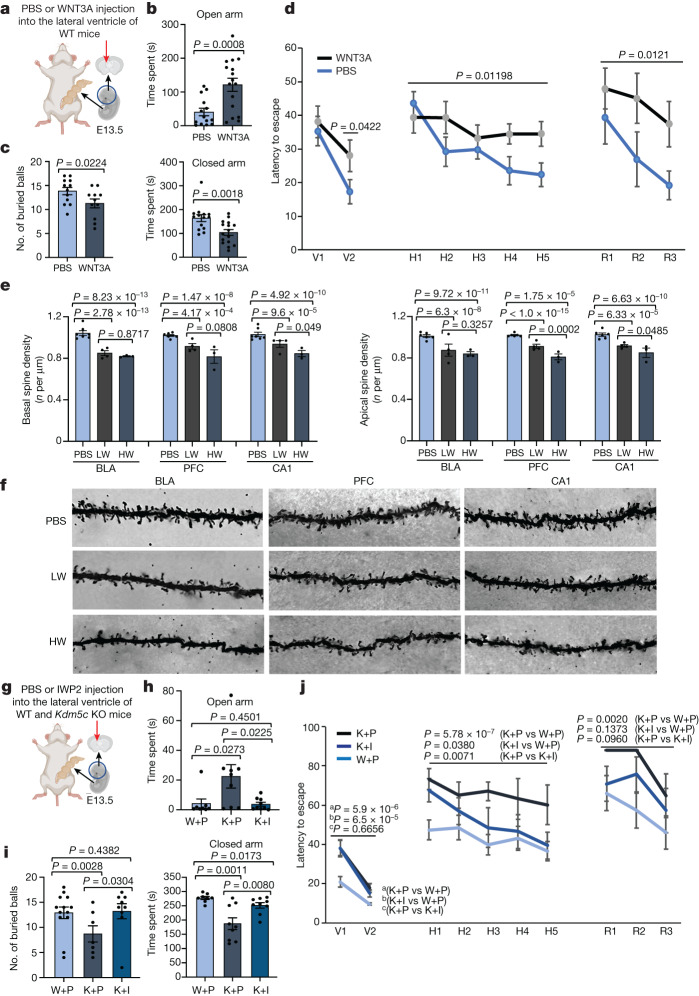
Fig. 5. A single WNT3A injection induces and WNT inhibition rescues KDM5C-associated ID phenotypes.
a, Schematic of the experiment. PBS or recombinant WNT3A (50 ng) was injected into the lateral ventricle of WT E13.5 embryos. b, Elevated-plus maze anxiety test. n = 14 (PBS treated) and n = 16 (WNT3A treated) mice. c, Marble-burying test in PBS-injected mice (n = 12) and WNT3A-injected mice (n = 11). Data for b and c represent the mean ± s.e.m. P values calculated using one-tailed unequal variance t-test. d, Morris water maze escape latency test. One-tailed unequal variance t-test for results from the visible platform condition (V1 and V2) and two-way analysis of variance (ANOVA) for the hidden platform (H1–H5) and reversal (R1–R3) conditions were performed. P values are indicated. Data are presented as the mean ± s.e.m. n = 15 (PBS injected) and n = 17 (WNT3A injected) mice. e, At E13.5, WT embryos were injected with PBS, a low dose of WNT3A (33 ng; LW) or a high dose of WNT3A (50 ng; HW). Spine density in the basolateral amygdala (BLA), prefrontal cortex (PFC) and CA1 of the hippocampus was analysed (number of spines per µm). One-way ANOVA followed by Tukey’s multiple comparison test is presented based on single measurements averaged for each group. P values are indicated. Data are expressed as the mean ± s.e.m. of average values for each mouse. n = 7 (PBS) mice for basal spine density, n = 6 (PBS) mice for apical spine density, n = 4 mice for LW treatment and n = 3 mice for HW treatment. f, Representative dendritic segments from BLA, PFC, and CA1 regions in mice treated with PBS or with a high or low dose of WNT3A. g, Schematic of injections in E13.5 WT (PBS) and Kdm5c KO embryos (PBS or the WNT inhibitor IWP2 (9.34 ng)). h, Elevated plus maze anxiety test. Number of mice analysed: 8 WT + PBS (W+P), 9 KO + PBS (K+P) and 9 KO + IWP2 (K+I). i, Marble-burying test. Number of mice analysed: 13 WT + PBS, 7 KO + PBS and 9 KO + IWP2. Data for h and i are presented as the mean ± s.e.m. P values were calculated using one-tailed unequal variance t-test. j, Morris water maze escape latency test. Two-way ANOVA for V1–V2, H1–H5 and R1–R3 was performed. P values are indicated. Data are expressed as the mean ± s.e.m. n = 12 WT + PBS, 7 KO + PBS and 9 KO + IWP2 mice. P < 0.05 was considered significant. Details provided in the Methods. Illustrations in a and g were created using BioRender (https://www.biorender.com).

