
Fig. 1. IL-10 signalling regulates sphingolipid metabolism.
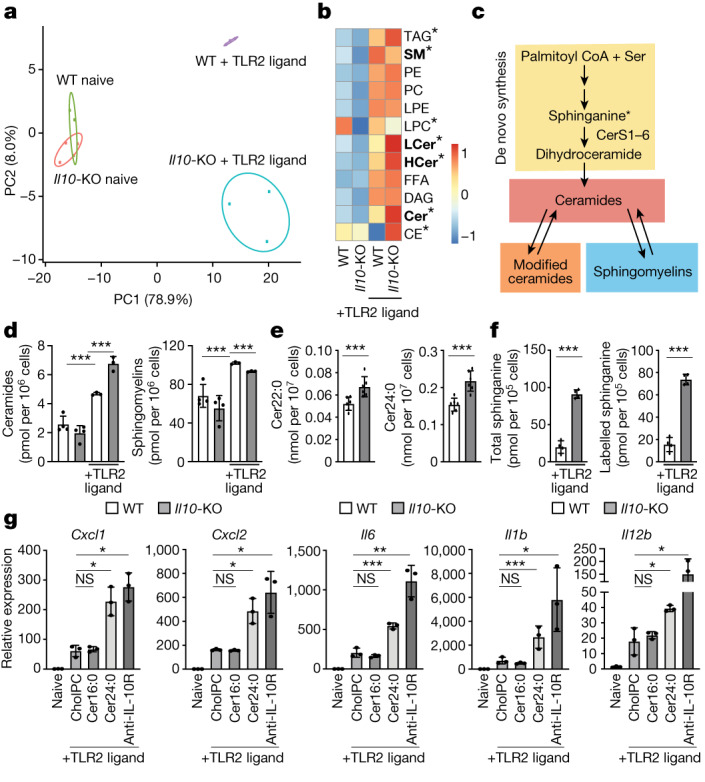
a, Principal component analysis (PCA) of individual lipids quantified by mass spectrometry from naive or TLR2-activated (50 ng ml−1 Pam3CysK4) wild-type and Il10-KO BMDMs for 48 h. The percentage of total variance explained by individual principal components (PC1 and PC2) is indicated. Prediction ellipses are set at 95% probability (n = 3–4). b, Heat map of individual lipid species measured by direct infusion mass spectrometry from naive BMDMs (left two columns) or TLR2-activated BMDMs (right two columns) stimulated as in a. Scaled by row (lipid species). Bolded text indicates *P < 0.05 between TLR2-activated wild-type and Il10-KO BMDMs. CE, cholesteryl esters; Cer, ceramides; DAG, diacylglycerols; FFA, free fatty acids; HCer, hexosyl ceramides; LCer, lactosyl ceramides; LPC, lysophosphatidylcholine; LPE, lysophosphatidylethanolamine; PC, phosphatidylcholine; PE, phosphatidylethanolamine; SM, sphingomyelins; TAG, triglycerides. c, Simplified schematic of sphingolipid metabolism. Ceramides are generated by de novo synthesis pathway at the endoplasmic reticulum. Ceramides can be further modified to generate hexosyl and lactosyl ceramides (modified ceramides), which can be broken back down into ceramides. Ceramides serve as the building blocks for all sphingomyelin species, which can also be broken down into ceramides. d, Total ceramides and sphingomyelin species measured by direct infusion mass spectrometry from BMDMs stimulated as in a (n = 3–4). e, Ceramide species measured by direct infusion mass spectrometry from ex vivo peritoneal macrophages collected from wild-type and Il10-KO mice after 48 h TLR2 ligand (50 μg Pam3CysK4 per mouse) administered via intraperitoneal injection (n = 6). f, LC–MS analysis of total and labelled sphinganine in 48 h TLR2-activated wild-type and Il10-KO BMDMs. (n = 4). g, Quantitative PCR (qPCR) analysis of inflammatory gene expression in naive BMDMs or BMDMs activated with TLR2 ligand (50 ng ml−1 Pam3CysK4) for 24 h. TLR2-activated macrophages were incubated with cholesteryl:phosphatidylcholine (cholPC) alone or with cholPC loaded with Cer16:0 or Cer24:0 or cholPC plus neutralizing anti-IL-10R (5 μg ml−1) for the last 20 h of the activation (n = 3 for each group). All lipids administered at a final concentration of 30 μM. All data are mean of biological replicates ± s.d. *P < 0.05, **P < 0.01, ***P < 0.005 (two-tailed unpaired Student’s t-test).