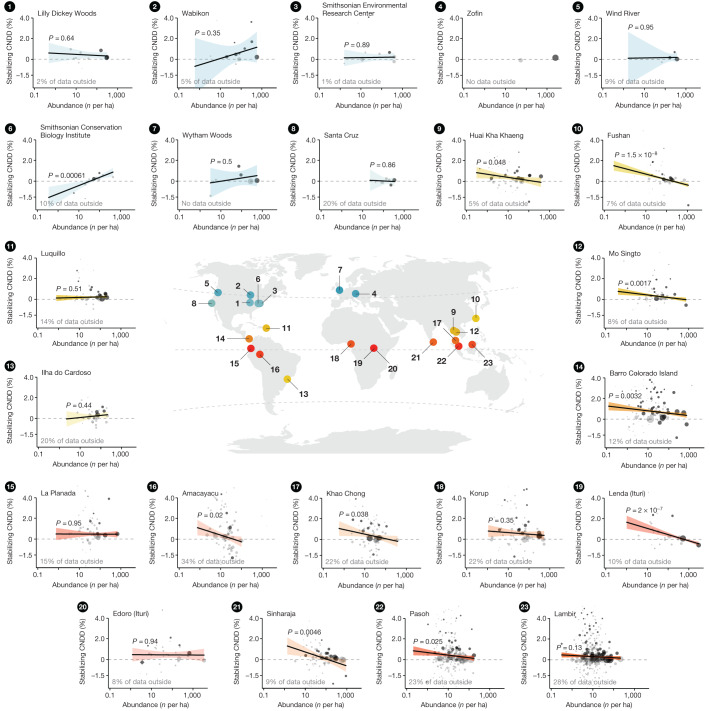
Fig. 1. Estimated stabilizing CNDD in tree mortality plotted against species abundance at the 23 forest plots, along with plot locations.
Points in small panels indicate CNDD estimates and abundances (number of trees with DBH ≥ 1 cm per hectare) of individual species or species groups. Larger point sizes indicate lower uncertainty (variance) in CNDD estimates. Points in dark grey indicate effects that are statistically significantly different from zero (with α = 0.05). Circles are individual species; diamonds are rare species analysed jointly as groups of rare trees or rare shrubs. Because of the high variation in CNDD estimates, not all species-specific estimates can be shown, but the proportion of data that is represented by the estimates outside the plotting area is indicated for each site. The regression lines, 95% confidence intervals (CI) and P values are based on meta-regression models fitted independently per site (except for the Zofin site, for which too few estimates were available). Dashed horizontal lines indicate zero stabilizing CNDD. Locations of forest sites and CNDD-abundance relationships are coloured by latitude (gradient from tropical forests in red–orange to subtropical forests in yellow–green and temperate forests in blue). Stabilizing CNDD is defined as the relative change (in %) in annual mortality probability (relative average marginal effect; rAME) induced by a small perturbation in conspecific density (one additional conspecific neighbour with DBH = 2 cm at a one-metre distance) while keeping total densities constant. Positive numbers indicate a relative increase in mortality with an increase in conspecific density; that is, CNDD.

