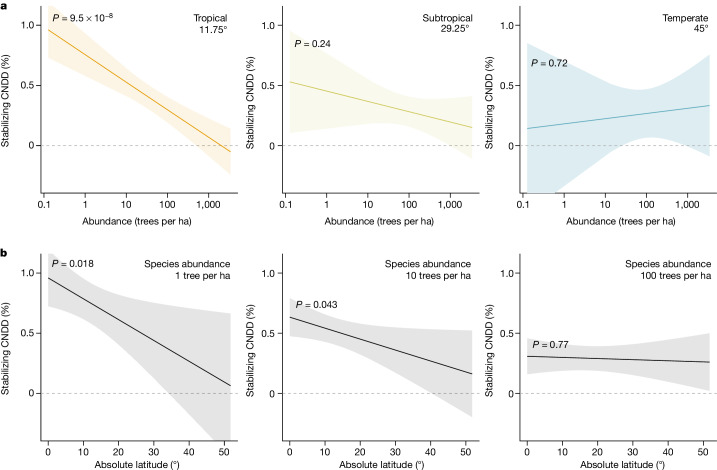
Fig. 3. Evaluation of the second hypothesized pattern, whereby CNDD more strongly regulates species abundances and thus community structure in the tropics.
a, The estimated relationship of stabilizing CNDD to absolute latitude and species abundance indicates that species-specific CNDD is considerably stronger for rare than for common species in tropical forests (P = 9.5 × 10⁻⁸), whereas species in subtropical and temperate forests show no statistically significant association between CNDD and species abundance (P = 0.24 and P = 0.72, respectively). b, Consequently, stabilizing CNDD of species with low abundance (here, one tree per hectare) is stronger in tropical than in temperate forests (P = 0.018), whereas CNDD of species with high abundance (here, 100 trees per hectare) shows no latitudinal gradient (P = 0.77). Note that a caveat to the comparison in b is that species abundance distributions and total community abundance change with latitude so that an abundance of one tree per hectare is not necessarily biologically comparable across latitudes. The regression lines and 95% CI are predictions from the meta-regression model (n = 2,534 species or species groups from 23 forest sites) including absolute latitude, species abundance and their interaction as predictors (‘abundance-mediated CNDD’ model; see Table 1b). Predictions in a are shown for the centres of three latitudinal geographic zones, with the tropical zone ranging between 0° and 23.5° absolute latitude, the subtropical between 23.5° and 35° and the temperate between 35° and 66.5°. Species abundance is quantified as the log-transformed number of trees per hectare. Confidence intervals and P values are obtained by refitting the model with data centred at the respective latitude or abundance value. Dashed horizontal lines indicate zero stabilizing CNDD. Stabilizing CNDD is defined as in Fig. 1; for the same plots with alternative definitions of CNDD, see Extended Data Figs. 4 and 5.

